Figures & data
Figure 1. Device for determining the food anisotropy: 1: metal box; 2: video camera; 3: capture and shielding con; 4: thick glass disc; 5: food sample; 6: ring of LEDs; 10: compression discs; 13: electronic power source; 14: PC.
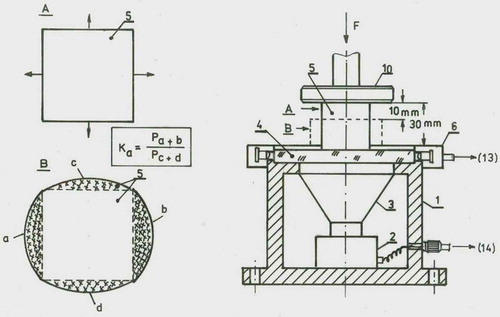
Figure 2. The testing direction and the preparation of the strawberry samples for the anisotropy measurement.
Table 1. Physico-chemical and color parameters of strawberry samples.
Table 2. The color difference.
Table 3. The anisotropy coefficient of elsanta, darselect and coral strawberry.
Table 4. Textural properties of elsanta, darselect and coral strawberry.
Table 5. Pearson corelation matrix between the textural, physico-chemical and color parameters.
Figure 3. A: Elsanta texture profile analysis; B: Darselect texture profile analysis; C: Coral texture profile analysis.
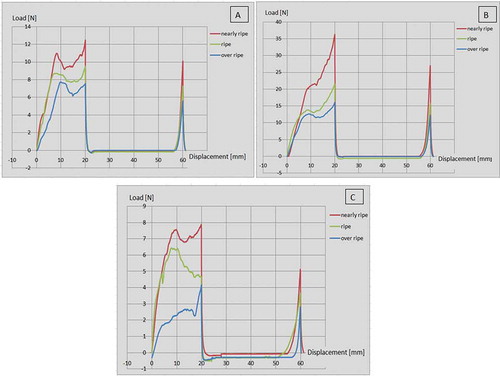
Figure 4. The strawberry anisotropy: A: The anisotropy of Elsanta strawberry; B: The anisotropy of Darselect strawberry; C: The anisotropy of Coral strawberry.
Figure 5. A: Elsanta creep curves; B: Darselect creep curves; C: Coral creep curves.
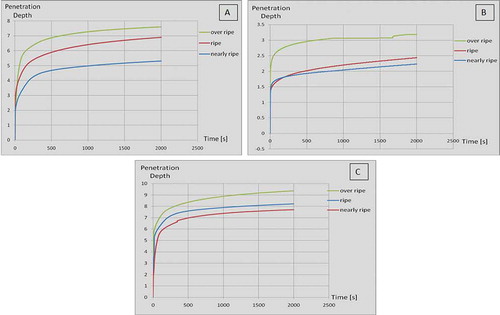
Figure 6. PCA scores of strawberry samples: p1: nearly ripe; p2: ripe; and p3: over ripe.
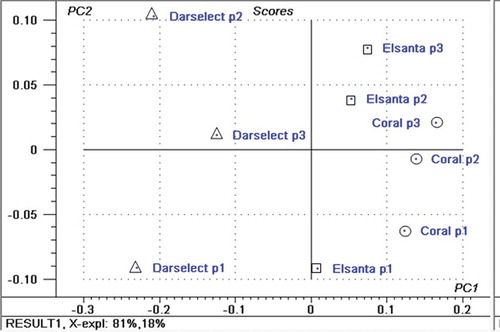
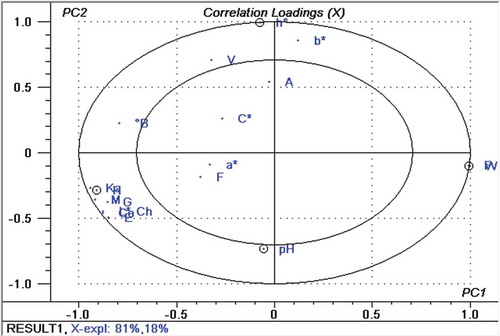
Figure 7. PCA loadings of strawberry samples. H: hardness; F: fracturability; V: viscosity; A: adhesiveness; E: elasticity; Co: cohesiveness; G: gumminess; Ch: chewiness; B: Brix concentration; M: moisture content; L*: brightness; a*: red–green axis; b*: yellow–blue axis; C*: chroma; h°: tone; P: penetration depth; W: mechanical work; Ka: anisotropy coefficient.