Figures & data
Table 1. Cooking times of untreated and microwave treated pulses.
Table 2. Characteristic bands of different functional group observed in the mid infrared spectra of pulses.[Citation31,Citation32,Citation39]
Figure 1. The average and area normalized FTIR spectra of the five pulses at 10% m.c. Inserts show the expanded view of lipid and protein regions. RL: Red lentil; CP: Chickpea; PP: Pigeon pea; MB: Mung bean; PB: Pinto bean.
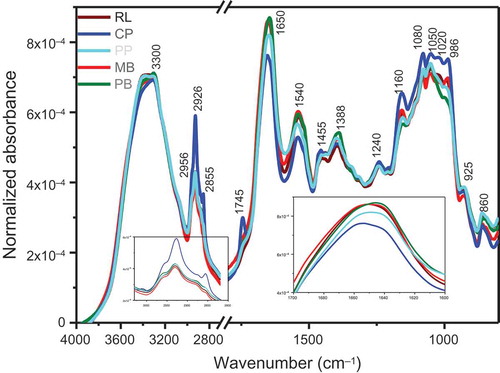
Figure 2. The PCA of the FTIR spectra of the five pulses in the lipid (a: 3100–2700 cm−Citation1) and fingerprint (c: 1800–800 cm−Citation1) regions of five pulses at 10% m.c. and the respective loading plots (b and d). RL: Red lentil; CP: Chickpea; PP: Pigeon pea; MB: Mung bean; PB: Pinto bean.
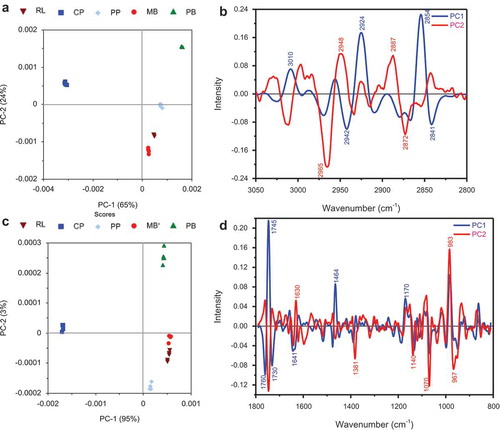
Figure 3. Second derivatives of the FTIR spectra of control and microwave treated pulses in the lipid A: (3000–2840 cm−Citation1) and amide I B: (1710–1600 cm−Citation1) regions. Each spectrum is the average of five independent spectra. a: red lentil; b: chickpea; c: pigeon pea; d: mung bean; and e: pinto bean.
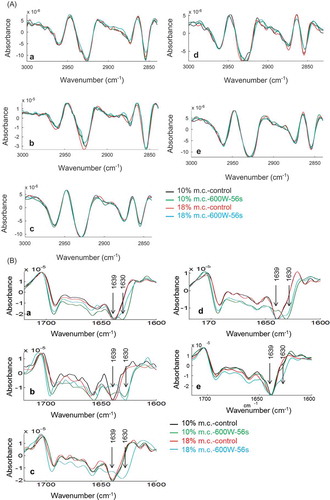
Figure 4. The SEM micrographs of untreated and microwave (18% m.c., 600 W, and 56 s treated) A: chickpea and B: mung bean.