Figures & data
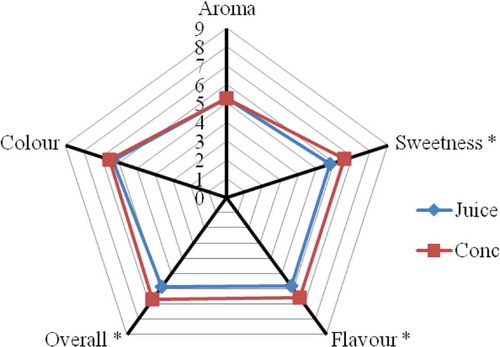
Figure 1. Betacyanin retention for juice and concentrate samples stored at 4 and 25°C throughout 8 weeks (mean ± standard deviation; n = 3). Small letters mean significant difference (p < 0.05) across the samples with storage time (weeks).
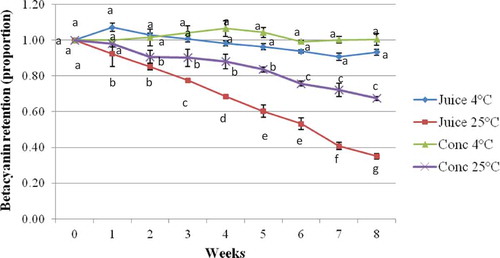
Figure 2. Ascorbic acid, mg/100 mL for juice and concentrate samples stored at 4 and 25°C throughout 8 weeks (mean ± standard deviation; n = 3). Small letters mean significant difference (p < 0.05) across the samples with storage time (weeks).
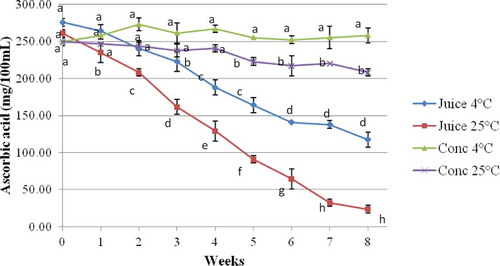
Table 1. Bacteria, yeast, and mold counts, expressed as cfu/mL for juice and concentrate samples before and after pasteurization and during storage at 4 and 25°C throughout 8 weeks (mean ± standard deviation; n = 3).
Table 2. Prediction functions and coefficient of determination (R2) values for zero- and first-order models fitted to the thermal degradation of betacyanin data.
Table 3. Prediction functions, R2, rate constant at 4°C and the calculated time to reach failure point if both juice and concentrate samples were to be stored in 4°C refrigerator.
Figure 3. Radar chart of mean scores for sensory attributes of dragon fruit juice and concentrate. Attributes with a significant difference (p < 0.05) are marked with an asterisk (*).