
Figures & data
Table 1. Material properties.
Figure 1. (a) A schematic of experimental setup for oil and water permeability measurement for potato discs. (b) Boundary conditions for Darcy’s law equation and structural displacement (P1 = applied pressure, Patm = atmospheric pressure).
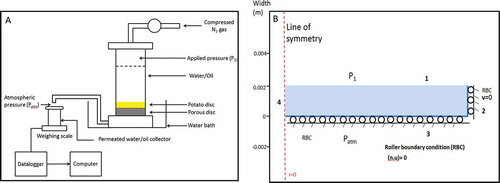
Figure 2. Oil permeability of potatoes at (a) 25°C, (b) 40°C, (c) 50°C, and (d) 70°C.
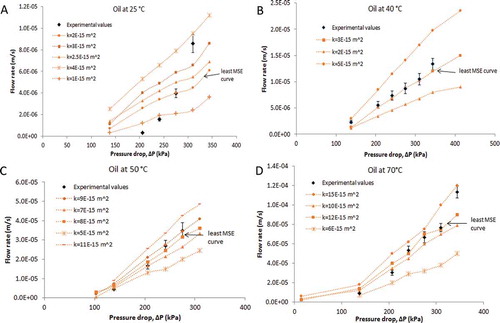
Figure 3. Water permeability of potatoes at (a) 70°C, (b) 75°C, and (c) 80°C.
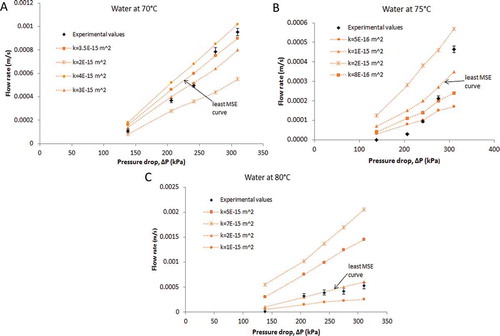
Figure 4. (a) The displacement of a raw potato idsc as a function of thickness under the applied pressure of 345 kPa. (b) The 2D view of compression of a raw potato disc under the applied pressure of 345 kPa.
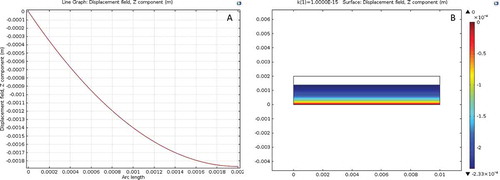
Table 2. Oil permeability data and fluid content of potato at different temperatures.
Table 3. Water permeability data and fluid content of potato at different temperatures.
Table 4. Change of thickness and weight of potato disc at different temperatures after pressure-driven oil flow.
Table 5. Change of thickness and weight of potato disc at different temperatures after pressure-driven water flow.
Table 6. Estimated constant values of oil and water permeability from 13 and 14.
Table