Figures & data
Figure 1. FTIR spectra of beef and lard in meatballs. Peak marked with a circle indicated the significant absorption bands for the differentiation.
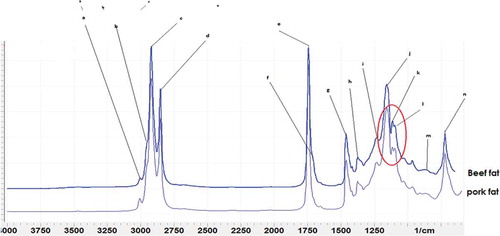
Figure 2. The relationship between the actual value of lard (x-axis) extracted from pork meatball with lard predicted by FTIR spectra-PLS model (y-axis) in the mixture of pork and beef.
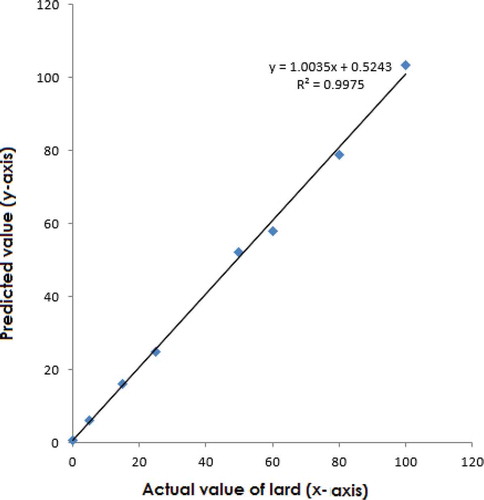
Figure 3. PCA analysis for classification of pork meatballs, beef meatballs and meatball samples. A: Pork meatballs 100%, B: beef meatballs 100%, and C: meatballs from commercial samples.
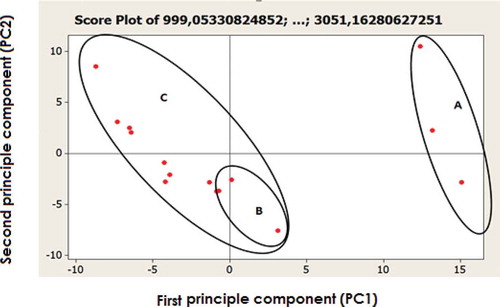
Figure 4. The scree plot relating the eigenvalue with principle components.
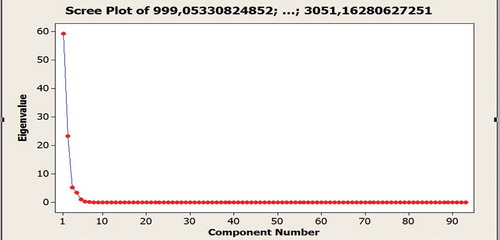
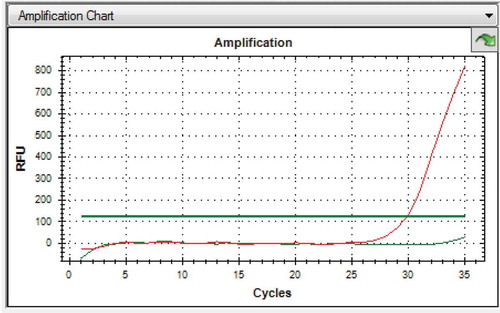
Figure 5. Amplification curves of Leptin Primer on DNA from meatballs. Red: Pork meatball; green: beef meatball.