Figures & data
Figure 1. The chemical structures of tea catechins and methylxanthines.
Table 1. Volatile compounds identified in the aroma concentrate of basic tea, finished jasmine tea and fresh flower of J. sambac.
Figure 2. (a) Changes of total peak area of jasmine tea samples during scenting process; (b) Changes of peak area of the seven main volatile compounds in tea A during scenting process; (c) Changes of peak area of the seven main volatile compounds in tea B during scenting process; (d) JTF index of jasmine tea samples at each round of scenting process. Values were expressed as mean value (n = 3).
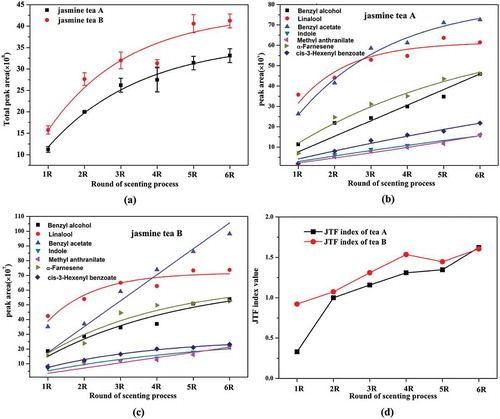
Table 2. Concentrations of gallic acid (mg/g DW), theobromine (mg/g DW), caffeine (mg/g DW), total soluble phenolics (TPS, mg gallic acid/g DW), and total catechins (TC, mg/g DW) during scenting process of jasmine tea A samples.
Table 3. Concentrations of gallic acid (mg/g DW), theobromine (mg/g DW), caffeine (mg/g DW), total soluble phenolics (TPS, mg gallic acid/g DW), and total catechins (TC, mg/g DW) during scenting process of jasmine tea B samples.
Figure 3. Changes of EGCG, ECG, EC, GCG, GC, EGC, and C concentrations in the jasmine tea A and B samples during scenting process.Values were expressed as mean value (n = 6).
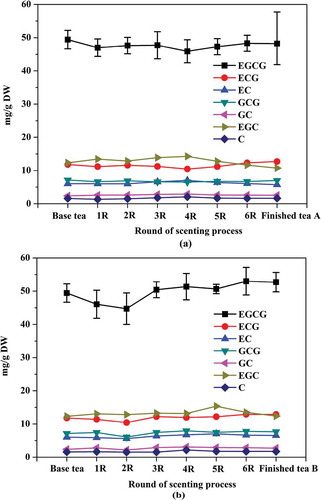
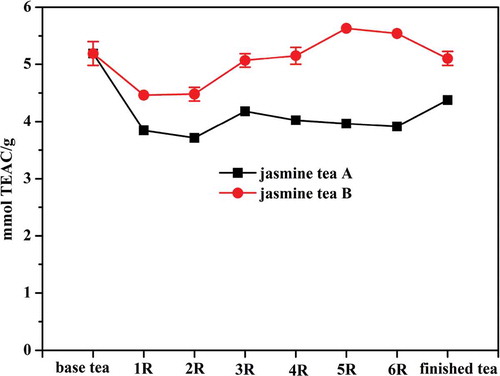
Figure 4. Changes of the antioxidant capacity of the jasmine tea samples during scenting process. Values were expressed as mean value (n = 3).