Figures & data
Table 1. Sugar composition (g/100 g) in the forms of mixed, liquid, and crystal honey.A
Figure 1. HPLC chromatograms of mixed standards of sugars (glucose, fructose, sucrose and maltose) and honeys in the forms of liquid, crystal and mixed . Peak 1, 2, 3 and 4 represents fructose, glucose, sucrose and maltose, respectively .
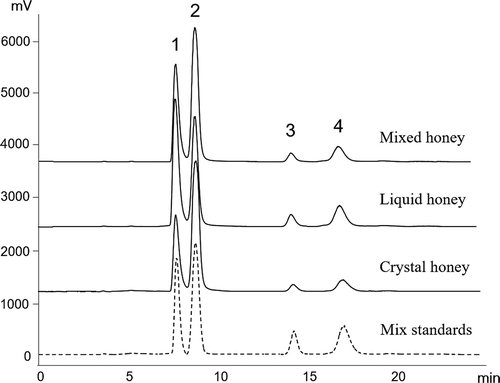
Figure 2. SEM images of crystal of honey (a and b) and glucose (c and d). The magnification of a, c and b, d was 1500 and 3000 times, respectively.
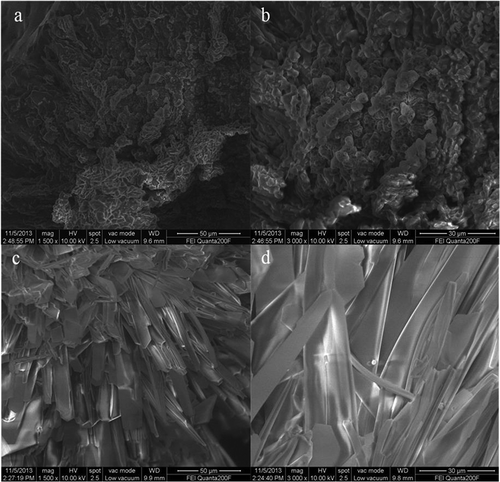
Table 2. RMSD, Rg, SASA, ΔEele, ΔEVdw and time value for models a, b, c, and d at the end of MD simulation.
Figure 3. Snapshots of crystallization process of honey with glucose/fructose ratio at 2.5:1 (model a) obtained from the MD simulation runs in water.
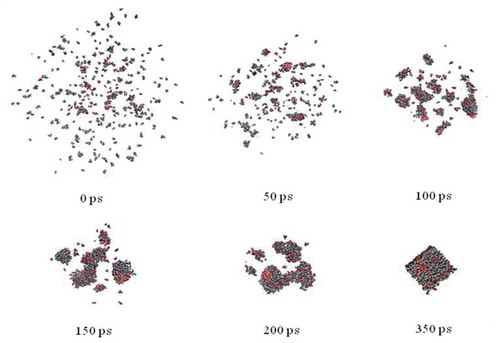
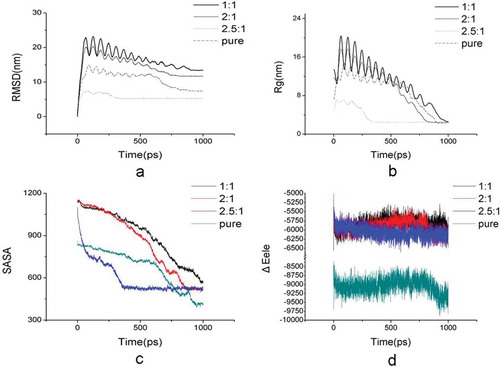
Figure 4. Plot curves of simulation systems of honey crystal with glucose/fructose ratio at 2.5:1, 2:1, 1:1 and pure glucose crystal versus time at 300 K; (a) Root mean square deviations (RMSD) change of simulation systems; (b) Radius of gyration (Rg) change of simulation systems; (c) Solvent-accessible surface area (SASA) change of simulation systems; (d) Electrostatic interaction (ΔEele) of simulation systems.