Figures & data
Table 1. Effect of extraction media on the recovery of lipase from Pacific white shrimp hepatopancreas*.
Figure 1. Effect of some surfactants on total activity (a) and specific activity (b) of lipase from Pacific white shrimp hepatopancreas. Different letters indicate significances (p < 0.05). Bars represent the standard deviation from triplicate determinations.
Figure 2. pH (a) and temperature (b) profiles of lipase from hepatopancreas of Pacific white shrimp. Bars represent the standard deviation from triplicate determinations.
Figure 3. Thermal (a) and pH (b) stability of lipase from hepatopancreas of Pacific white shrimp. Bars represent the standard deviation from triplicate determinations.
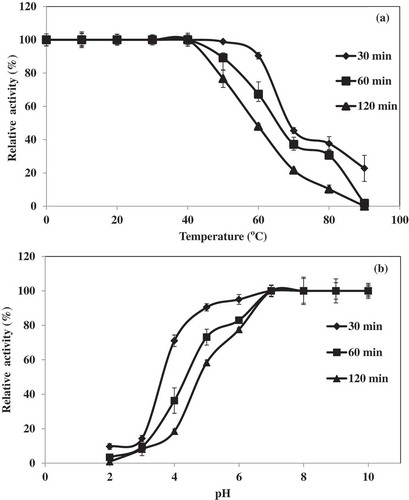
Figure 4. Effect of NaDC concentration of lipase from hepatopancreas of Pacific white shrimp. Bars represent the standard deviation from triplicate determinations.
Figure 5. Effect of NaCl concentration of lipase from hepatopancreas of Pacific white shrimp. Bars represent the standard deviation from triplicate determinations.
Table 2. Effect of selected chemicals on the stability of lipase from hepatopancreas of Pacific white shrimp.
Table 3. Effect of different surfactants on the stability of lipase from Pacific white shrimp hepatopancreas.
Figure 6. Stability of crude lipase from hepatopancreas of Pacific white shrimp in presence of various commercial liquid (a) and solid (b) laundry detergents. The different letters indicate significant differences (p < 0.05).