Figures & data
Table 1. Chemical composition of mungbean, rice, and tapioca starches.
Figure 1. Appearance changes of different starches when complexing with menthone. Comparing between control starch samples (C) and menthone complexes (M).
Figure 2. Light micrographs of starch complexation with menthone (a) mungbean (b) rice and (c) tapioca. All pictures were taken under the same magnification (40×), bar equals 20 µm.
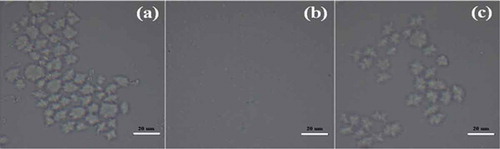
Table 2. Yield of starch precipitation, menthone entrapment and stoichiometrya of starch menthone complexes.
Figure 3. WAXD pattern for menthone inclusion complexes and control samples: (a) mungbean (b) rice and (c) tapioca starch.

Figure 4. Size exclusion chromatogram of native starches and their menthone complexes.
Figure 5. DSC thermograms of control samples (a) mungbean (b) rice and (c) tapioca.
Figure 6. DSC thermograms of starch menthone complexes (a) mungbean (b) rice and (c) tapioca.