Figures & data
Table 1. Nutritional information of hummus recipe*.
Figure 1. A: Amplitude sweep data at 1 Hz for commercially available Spanish hummus, showing the changes in elastic modulus (G′), viscous modulus (G″), and loss tangent (tan δ); B: Mechanical spectrum data from 0.01 to 10 Hz (strain amplitude at 0.01%). Mean values of 12 measurements ± standard deviation.
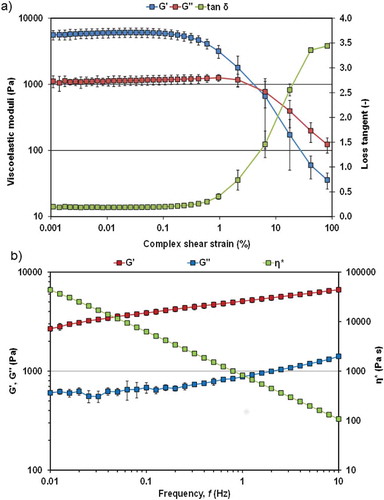
Table 2. Oscillatory rheological properties and power law parameters derived from frequency sweep tests carried out at 1 Hz and strain amplitude of 0.01% in the LVE range.
Figure 2. a) Typical temperature sweep test at 1 Hz showing the changes in elastic modulus (G′), viscous modulus (G″), and loss tangent (tan δ) for a single sample of commercially available Spanish hummus (strain amplitude at 0.01%) b) Creep and recovery compliance J(t) data with increasing applied shear stress. Mean values of 12 measurements.
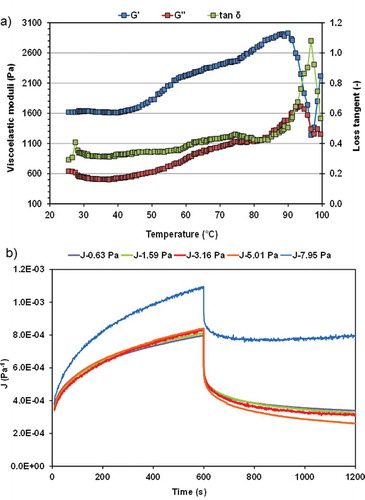
Figure 3. a) Flow curves for commercially available Spanish hummus measured by increasing (forward measurements) and decreasing shear rate (backward measurements) without shearing. Mean values of 12 measurements ± standard deviation b) Flow curve fitted to the Herschel-Bulkley model for a single sample of commercially available Spanish hummus after shearing at 300 s−1 for 5 min.
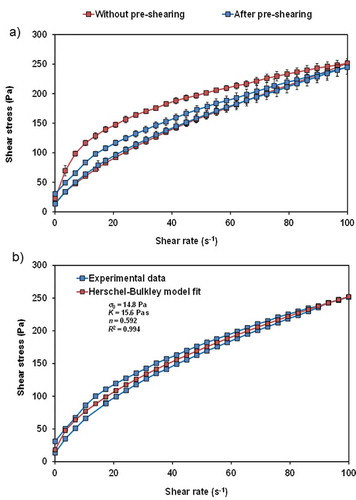
Figure 4. a) Typical three-step shear rate test for a single sample of commercially available Spanish hummus, showing the changes in viscosity versus time b) Applicability of Cox-Merz rule for the commercially available Spanish hummus. Mean values of 12 measurements ± standard deviation.
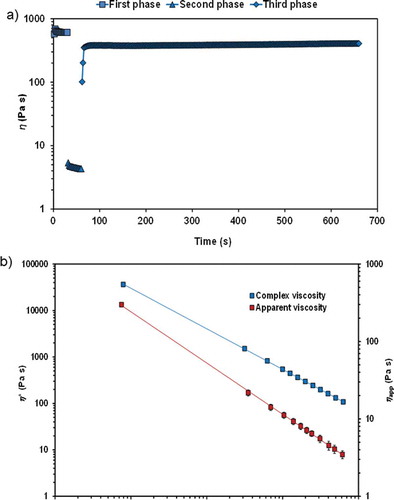
Figure 5. Micrographs of commercial hummus at different magnifications. a) ×50 b) ×300 c) ×500 d) ×2000.
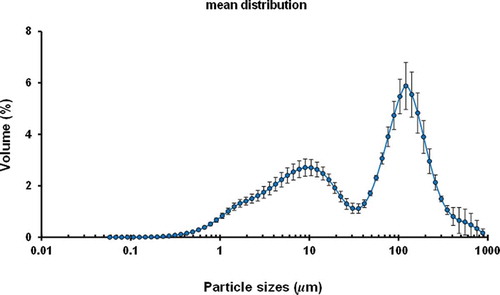
Figure 6. Particle size distribution of commercially available Spanish hummus. Mean values of nine measurements ± standard deviation.