Figures & data
Table 1. Type and integral values of protons obtained from the 1H-NMR of the EM and CHCl3 fractions of seaweed S. wightii.
Table 2. Phenolic content, antioxidant, anti-inflammatory, antidiabetic, and ACE inhibitory activities of the EM and CHCl3 fractions of the seaweed S. wightii.
Figure 1. FT-IR spectra of A: EM and B: CHCl3 solvent fractions of S. wightii. The functional groups representing the distinct regions of the IR spectra were illustrated as (1) OHν of phenols and/or alcohols or N-Hν of amide groups, (2) >C=Oν of aldehydes or saturated aliphatic groups, (3) C-Cν of the aryl ring framework, and (4) C=Cν of olefinic groups. Stretching vibration has been indicated by “ν” as subscript to the functional group.
Figure 2a. 1H-NMR spectra of EM.
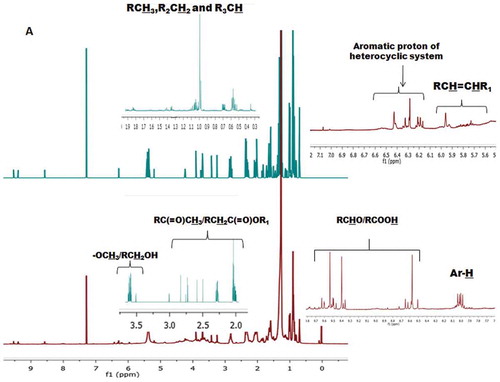
Figure 2b. CHCl3 solvent fractions of S. wightii. The protons at the defined regions of the 1H-NMR spectra were integrated to get the number of protons in specific regions.
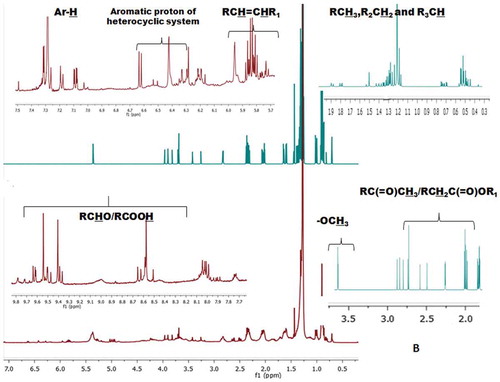
Figure 2c. The stacked plot representing the 13C-NMR spectra of EM and CHCl3 fractions of S. wightii. The functional groups representing the distinct regions of the 1H- and 13C-NMR spectra were labeled.
Figure 3. Loading plot diagram (various components viz., PC-1 and PC-2 in rotated space) of antioxidant activities vis-à-vis anti-inflammatory, anti-diabetic and anti-hypertensive activities of different solvent fractions from S. wightii.