Figures & data
Figure 1. Effect of A: extraction temperature, B: pH, C: ratio of water to raw material, D: extraction time, and E: E/S on the DPPH scavenging activity.
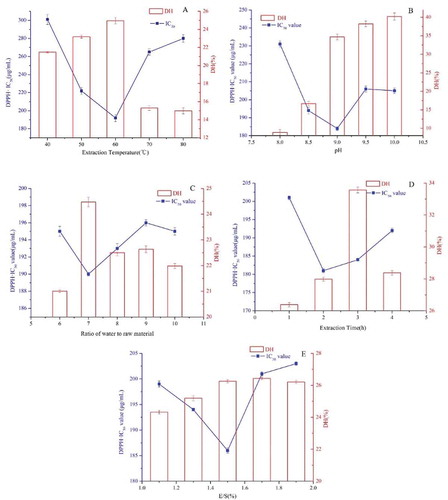
Table 1. Analysis of variance for the fitted quadratic polynomial model of the DPPH.IC50 value.
Figure 2. Response surface plots for the effects of E/S and extraction time (A,a); E/S and extraction temperature (B,b); and extraction temperature and extraction time (C,c) on the DPPH.IC50 value.
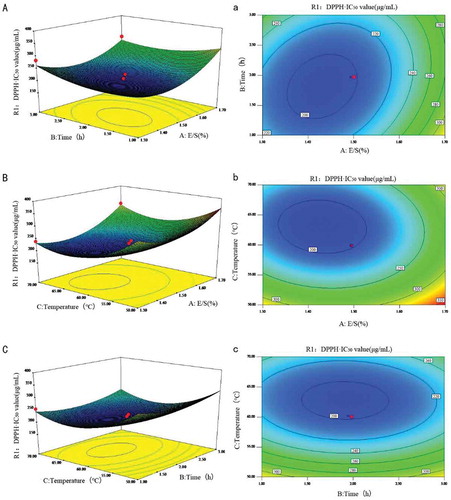
Table 2. Antioxidant activities of protein hydrolysate fractions separated by ultrafiltration.
Table 3. Amino acid of protein hydrolysate fractions separated by ultrafiltration.
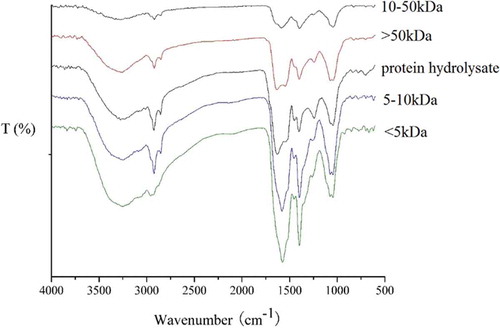
Figure 3. Results of FTIR spectra.