
Figures & data
Table 1. Proximate composition of native water chestnut starch (nWCS).
Figure 1. Scanning electron micrographs of native water chestnut starch (nWCS) under 1000× magnification.
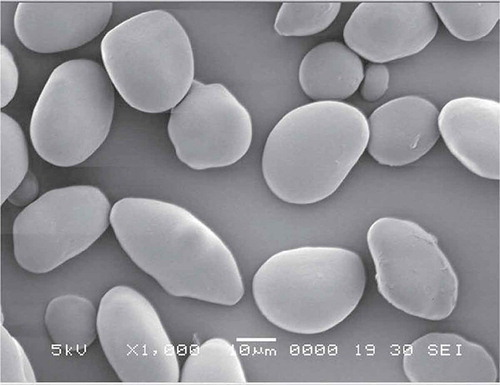
Figure 2. Scanning electron micrographs of pregelatinized water chestnut starch (pgWCS) under 1000× magnification.
Figure 3. Scanning electron micrographs of acetylated water chestnut starch (aWCS) under 1000× magnification.
Figure 4. Scanning electron micrographs of acid-thinned water chestnut starch (atWCS) under 1000× magnification.
Figure 5. Scanning electron micrographs of pregelatined acid-thinned water chestnut starch (pgatWCS) under 1000× magnification.
Figure 6. Scanning electron micrographs of pregelatinized acetylated water chestnut starch (pgaWCS) under 1000× magnification.
Table 2. Effect of temperature on (%) swelling power of nWCS, pgWCS, aWCS, atWCS, pgatWCS, and pgaWCS at 50, 60, 70, 80, and 90°C.
Table 3. Effect of temperature on (%) solubility of nWCS, pgWCS, aWCS, atWCS, pgatWCS, and pgaWCS at 50, 60, 70, 80, and 90°C.
Table 4. Effect of temperature on (%) water retention capacity of nWCS, pgWCS, aWCS, atWCS, pgatWCS, and pgaWCS at 50, 60, 70, 80, and 90°C.
Table 5. Effect on (%) transmittance of nWCS, pgWCS, aWCS, atWCS, pgatWCS, and pgaWCS at 0 h.
Table 6. Effect on (%) freeze thaw stability of nWCS, pgWCS, aWCS, atWCS, pgatWCS, and pgaWCS.
Table 7. The (%) water absorption of nWCS, pgWCS, aWCS, atWCS, pgatWCS, and pgaWCS.
Table 8. Effect on pasting behavior of nWCS, pgWCS, aWCS, atWCS, pgatWCS, and pgaWCS.