
Figures & data
Figure 1. Flowchart of leaf protein concentrate (LPC) production by A: sonicated and B: non-sonicated Fellows[Citation9] methods.
![Figure 1. Flowchart of leaf protein concentrate (LPC) production by A: sonicated and B: non-sonicated Fellows[Citation9] methods.](/cms/asset/7359a145-4460-481e-befa-cef2761add83/ljfp_a_1199034_f0001_b.gif)
Figure 2. A: DSC and B: TGA graphs of sonicated and non-sonicated LPC of Diplazium esculentum.
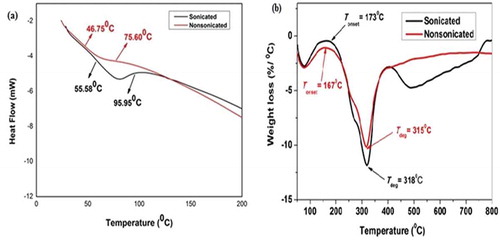
Figure 3. Contact-angle of (a): sonicated and (b): non-sonicated LPC of Diplazium esculentum.
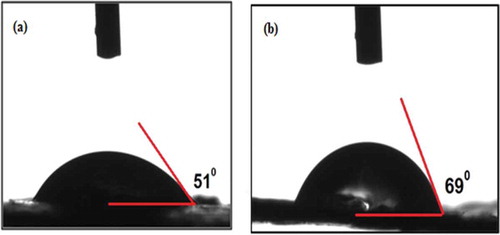
Figure 4. FTIR and deconvoluted FTIR graphs of A: sonicated and B: non-sonicated LPC of Diplazium esculentum.
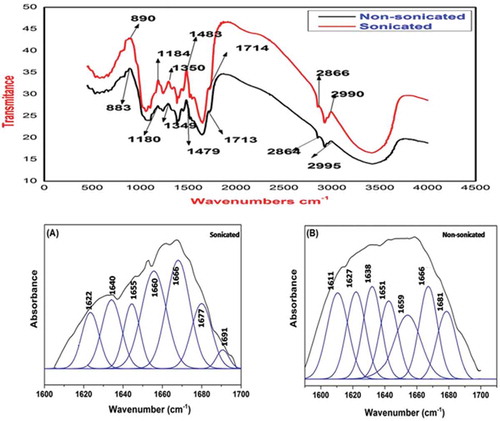
Table 1. Functional properties parameters of sonicated and non-sonicated LPC of Diplazium esculentum.
Table 2. FTIR analysis of sonicated and non-sonicated LPC of Diplazium esculentum.
Table 3. Quantification of secondary structure of protein of Diplazium esculentum.