Figures & data
Figure 1. Illustration of grain softening during soaking and cooking, A: Overall experiment assembly; and B: Pictorial representation of measurement process.
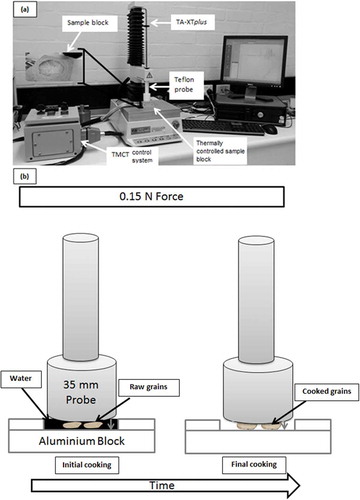
Figure 2. Probe displacement during in situ soaking of rice in a TMCT device at two compression forces, A: 0.10 N; and B: 0.15 N.
Figure 3. The in situ TMCT cooking of rice at 95 ± 1°C with two different rice to water ratios (1:2 and 1:3).
Figure 4. Comparison of A: grain softening measured as probe displacement by using TMCT; and B: moisture uptake during hydration of fresh TDK8 at different soaking temperatures (22, 40, and 50°C).
Figure 5. Comparison of A: grain softening measured by the displacement of probe by using TMCT; and B: moisture uptake during hydration of aged TDK8 at different soaking temperatures (22, 40, and 50°C).
Figure 6. Grain softening measured by probe displacement using TMCT for A: Doongara; and B: TDK11 rice varieties during hydration at different soaking temperatures (22, 40, and 50°C).
Figure 7. The in situ TMCT cooking curves for various rice varieties (Fresh TDK8, Doongara, TDK11 and aged TDK8) cooked at 95 ± 1°C using rice to water ratios of 1:3. Black arrows and numbers correspond to cooking time.
Figure 8. The in situ TMCT cooking of rice at 95 ± 1°C with two different rice to water ratios (1:10 and 1:3).
Table 1. The rate of cooking indicated by the rate of probe displacement during in situ cooking of selected rice varieties (fresh and aged TDK8, TDK11, and Doongara). Higher rate signifies faster cooking rate.
Figure 9. The RVA viscographs of various rice varieties, A: Fresh TDK8; B: Aged TDK8; C: TDK11; and D: Doongara.
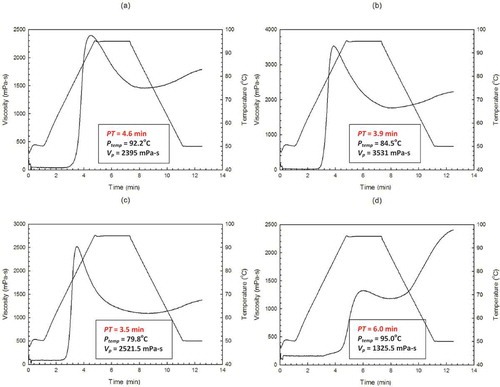
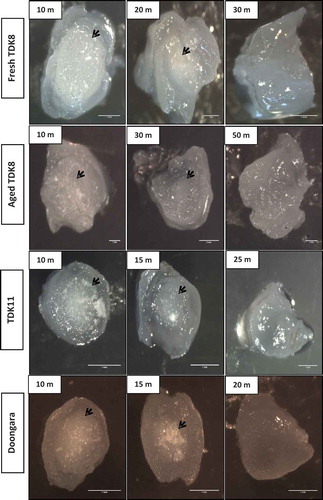
Figure 10. The light microscopy of fresh and aged TDK8, TDK11, and Doongara rice kernels during cooking at 95 ± 1°C (The non-gelatinized white belly areas are indicated by black arrows).