Figures & data
Figure 1. A: An example of a cube image of beef muscles (y = number of pixel; x = number of pixels, z = number of LED; in our study x = 1200 pixels, y = 1200 pixels, and z = 19) and image of Biceps femoris: B; Longissimus thoracis: C and Semimembranosus: D muscles recorded after excitation at 405 nm for Limousine breed.
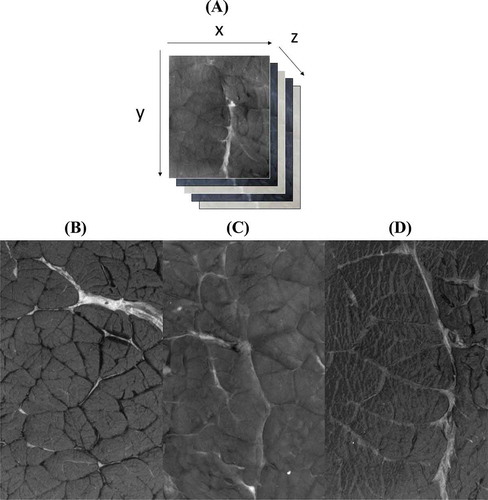
Figure 2. Process of GLCM (Gray level co-occurrence matrix) features extraction from the Region of interest (ROI; A, B, and C: the three steps necessary for the extraction of the GLCM texture features; X: number of pixels in the x axis, 575; Y: number of pixels in the y axis, 700; Z: number of LED, 19; Moy: Mean; Var: Variance; ASM: Angular second moment; CONT: Contrast, CORR: Correlation; CORRN: Non normalized correlation; ENT: Entropy; HOM: Homogeneity; DIAG: Diagonal moment; CSHADE: Cluster shade; CPROM: Cluster prominence).[Citation1]
![Figure 2. Process of GLCM (Gray level co-occurrence matrix) features extraction from the Region of interest (ROI; A, B, and C: the three steps necessary for the extraction of the GLCM texture features; X: number of pixels in the x axis, 575; Y: number of pixels in the y axis, 700; Z: number of LED, 19; Moy: Mean; Var: Variance; ASM: Angular second moment; CONT: Contrast, CORR: Correlation; CORRN: Non normalized correlation; ENT: Entropy; HOM: Homogeneity; DIAG: Diagonal moment; CSHADE: Cluster shade; CPROM: Cluster prominence).[Citation1]](/cms/asset/7b631ae3-1629-4f97-8577-60881df016a6/ljfp_a_1210163_f0002_b.gif)
Figure 3. Process of GLHD (gray level histogram difference) features extraction from the region of interest (ROI; A, B, and C: the three steps necessary for the extraction of the GLHD texture features; X: number of pixels in the x axis, 575; Y: number of pixels in the y axis, 700; Z: number of LED, 19; V: image obtained after translation; U: initial image having the same number of pixel as the image V; W: image obtained after subtraction of pixel of image V from pixel of image U; MOY: Mean, VAR: Variance, ASM: Angular second moment, CONT: Contrast, ENT: Entropy).
Figure 4. Process of multispectral image acquisition and data (image mean spectra, GLHD: Gray level histogram difference and GLCM: Gray level co-occurrence matrix) extraction.
Figure 5. Example of mean spectral data of the three muscles based on limousine breed (BF: biceps femoris; LT: longissimus thoracis; SM: semimembranosus).
Figure 6. Mean spectral data performed on the three muscles types for each animal types (AA: Aberdeen angus, LI: Limousine, BA: Blonde d’Aquitaine).
Table 1. PLSDA results of beef meat samples for calibration and external validation based on the animal breed.
Table 2. PLSDA results of beef meat samples for calibration and external validation based on the muscle type.
Figure 7. PLS-DA score plot of the two first loading vectors (LV); A: illustrating the separation of the three beef muscles for the different animal types (BF: biceps femoris; LT: longissimus thoracis; SM: semimembranosus), and loading plot; B: depicting the contribution of the wavelengths to the muscles discrimination.