Figures & data
Figure 1. A: The raw NIR spectra; and B: the SNV preprocessed spectra of EWP enzymolysis samples.
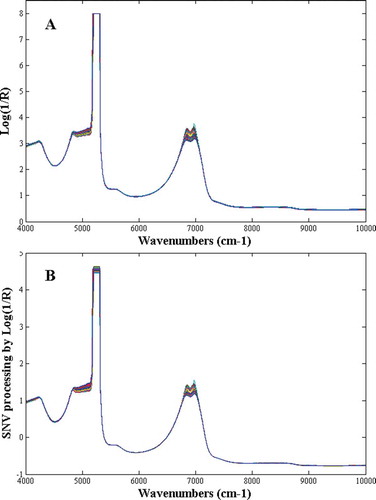
Figure 2. Variation trend of DH values during the enzymatic hydrolysis of egg white protein.
Table 1. Reference measured values of DH of samples in the calibration and prediction sets.
Figure 3. Spectral variables selected by A: UVE, B: CARS, and C: UVE-ACO.
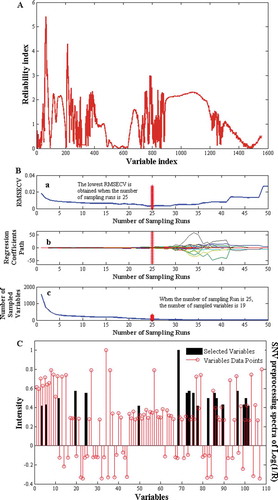
Figure 4. Scatter plots between reference measurements and NIR predicted results in calibration and prediction sets for A: PLS, B: UVE-PLS, C: CARS-PLS, and D: UVE-ACO-PLS.
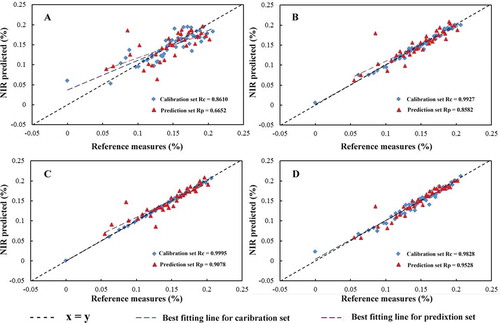
Table 2. Results of different regression models for predicting the DH values in EWP enzymolysis.
Figure 5. RE (%) values of three times NIR predicted values for DH.