Figures & data
Table 1. The sensory evaluation results (Mean ± standard deviation) of five different honey.
Table 2. Volatile compounds in the five honey samples (mg kg−1, n = 3) identified by SPME/GC-MS.
Figure 1. TIC profiles for five honey samples fractionated by SPME using DVB/CAR/PDMS fiber coating.
Figure 2. PLSR correlation loading plot of sensory attributes and volatile compounds identified by GC-MS from different honey samples. The model was derived from volatile compounds data as the X-matrix and sensory attributes and honey samples as the Y-matrix. Elipses represent R2 = 0.5 and 1.0, respectively.
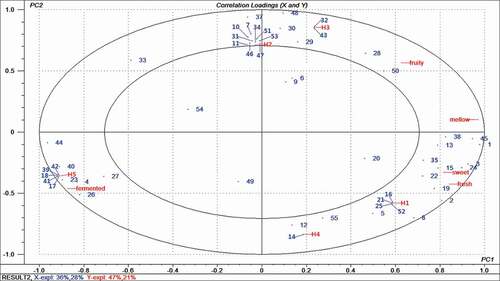
Figure 3. The radar fingerprints of five different honey samples. ▲ = H3; ■ = H2; ● = H5; ⋆ = H1; - = H4.
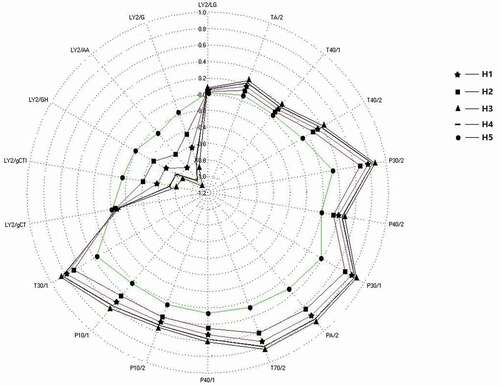
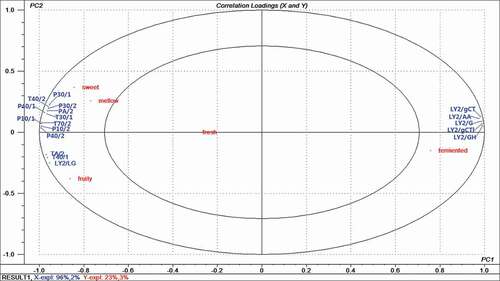
Figure 4. PLSR correlations loading plot of sensory attribute and electronic nose sensors from five honey samples. The model was derived from electronic nose sensors as the X-matrix and sensory attributes as the Y-matrix. Ellipses represent R2=0.5 and 1.0, respectively.