1,260
Views
13
CrossRef citations to date
0
Altmetric
Articles

Characterization and antioxidant activities of procyanidins from lotus seedpod, mangosteen pericarp, and camellia flower

, , , , , & show all
Pages 1621-1632 | Received 22 Apr 2016, Accepted 19 Jul 2016, Published online: 23 Nov 2016

Figures & data

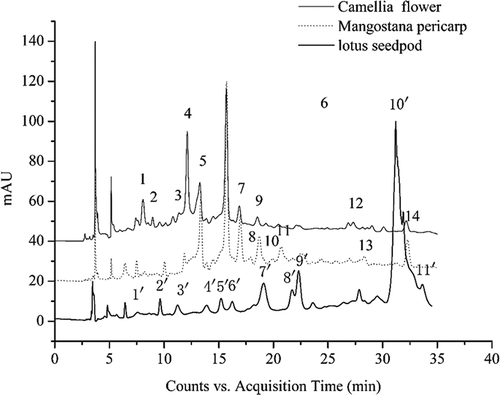
Figure 1. The HPLC chromatogram of LSPC, MPPC, and CFPC at 280 nm.

Figure 1. The HPLC chromatogram of LSPC, MPPC, and CFPC at 280 nm.

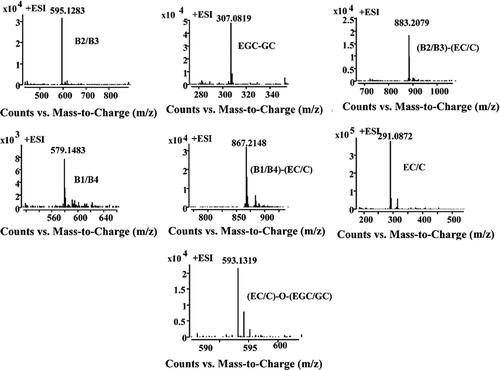
Figure 2. The MS spectra of procyanidins in LS, MP, and CF.

Figure 2. The MS spectra of procyanidins in LS, MP, and CF.

Table 1. The procyanidin compounds in lotus seedpod, mangosteen pericarp and camellia flower identified by HPLC−QTOF-MS.[Citation26Citation30]

Table 2. The antioxidant activities of LSPC, MPPC, and CFPC.

Figure 3. Effects of LSPC, MPPC, and CFPC at different concentrations on HUVECs. Control group meant cells without treatment of procyanidins, and the experimental groups were treated with LSPC, MPPC, and CFPC at 10, 50, 100, 200, 400, and 800 μg/mL, respectively. The values were expressed as means ± SD (n = 3). Different letters indicate significant difference by ANOVA, p < 0.05.
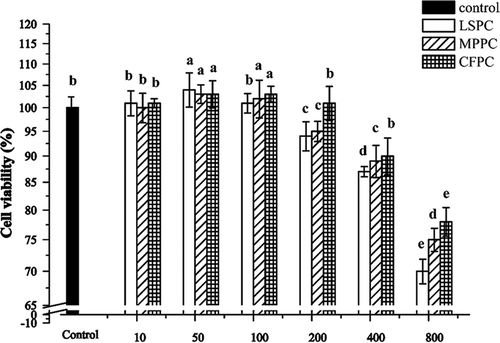
Figure 3. Effects of LSPC, MPPC, and CFPC at different concentrations on HUVECs. Control group meant cells without treatment of procyanidins, and the experimental groups were treated with LSPC, MPPC, and CFPC at 10, 50, 100, 200, 400, and 800 μg/mL, respectively. The values were expressed as means ± SD (n = 3). Different letters indicate significant difference by ANOVA, p < 0.05.

Figure 4. Effects of LSPC, MPPC, and CFPC on cell viability in H2O2 injured HUVECs. The results were expressed as percentage of control, and each value represents mean ± SD of three independent experiments. Control group meant cells without treatment of procyanidins. H2O2 group meant cells treated with 150 μM H2O2 for 8 h. The experimental groups were treated with 150 μM H2O2 + 10, 50, 100, 200 μg/mL LSPC, MPPC, and CFPC, respectively. Different letters (a, b, c) mean significantly different (p < 0.05) with each other.
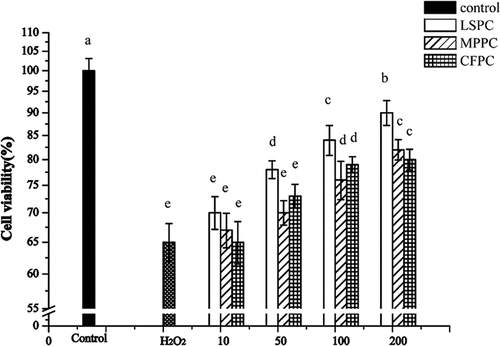
Figure 4. Effects of LSPC, MPPC, and CFPC on cell viability in H2O2 injured HUVECs. The results were expressed as percentage of control, and each value represents mean ± SD of three independent experiments. Control group meant cells without treatment of procyanidins. H2O2 group meant cells treated with 150 μM H2O2 for 8 h. The experimental groups were treated with 150 μM H2O2 + 10, 50, 100, 200 μg/mL LSPC, MPPC, and CFPC, respectively. Different letters (a, b, c) mean significantly different (p < 0.05) with each other.

Table 3. The effects of LSPC, MPPC, and CFPC on MDA content, SOD and GSH-Px activities, NO and ET-1 contents in H2O2-induced HUVECs.

Reprints and Corporate Permissions

Please note: Selecting permissions does not provide access to the full text of the article, please see our help page How do I view content?

To request a reprint or corporate permissions for this article, please click on the relevant link below:

Academic Permissions

Please note: Selecting permissions does not provide access to the full text of the article, please see our help page How do I view content?

Obtain permissions instantly via Rightslink by clicking on the button below:

If you are unable to obtain permissions via Rightslink, please complete and submit this Permissions form. For more information, please visit our Permissions help page.