
Figures & data
Table 1. Amount of hydrocolloids used for each sample and abbreviations of the samples.
Table 2. Moisture%, fat%, protein%, and WHC of the frankfurters.
Table 3. Cook loss and total expressible fluid results.
Table 4. Thermal denaturation temperatures and enthalpies of meat batters.
Figure 1. DSC thermogram of minced meat 1: denaturation peak of myosin; 2: denaturation peak of sarcoplasmic proteins; and 3: denaturation peak of actin.
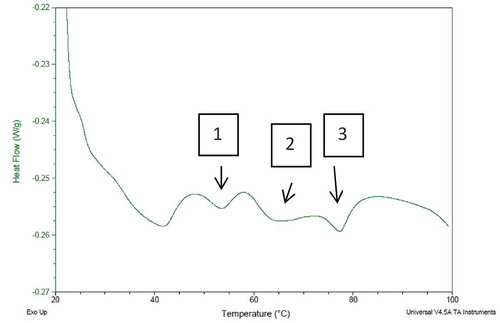
Figure 2. FTIR results of control group.
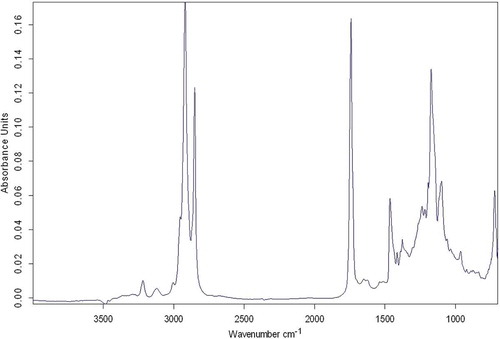
Table 5. Texture profile analysis.
Figure 3. SEM images of the samples A: Control; B: 0.5% κCGN; C: 1% κCGN; D: 0.5% λCGN, E: 1% λCGN; F: 0.5% GG; G: 1% GG; H: 0.5% XTG; I: 1% XTG; J: 0.5% CHI; and K: 1% CHI containing samples.
Table 6. Sensory evaluation results.
Table 7. Color measurement results of frankfurters.