Figures & data
Table 1. Chemical characterization of the studied oils.
Table 2. The fatty values determined in the present work.
Table 3. Wavenumbers observed in the IR and Raman spectra of the walnut oil.
Table 4. The wavenumbers (ν) and integral intensity (A) of some selected bands from the IR and Raman spectra of the studied oils.
Figure 1. ATR/FT-IR spectra of oils A: Sunflower; B: Corn; C: Low-linolenic flax; D: High-linolenic flax; E: Walnut; F: Hazel; and G: Rapeseed.
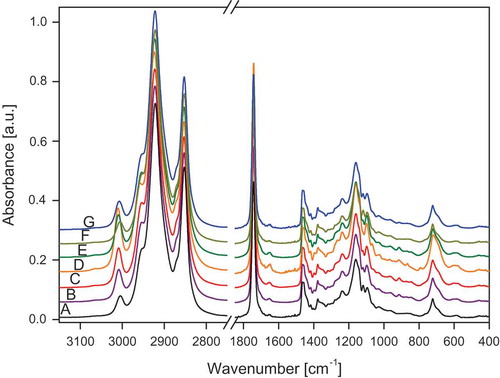
Figure 2. ATR/FT-IR spectra of oils H: Roasted sesame; I: Avocado; J: Hemp; K: Safflower; L: Pumpkin seed; M: Rice.
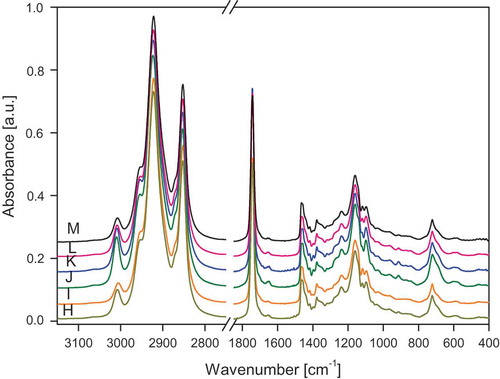
Figure 3. Raman spectra of oils A: Sunflower; B: Corn; C: Low-linolenic flax; D: High-linolenic flax; E: Walnut; F: Hazel; G: Rapeseed.
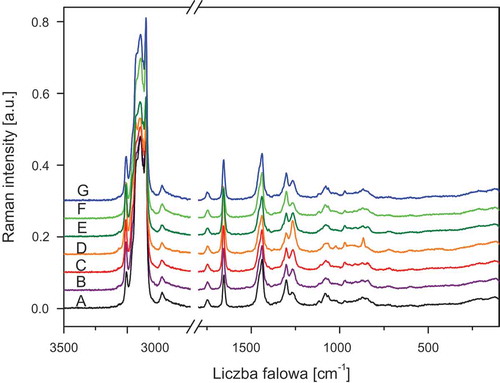
Figure 4. Raman spectra of oils H: roasted sesame; I: avocado; J: hemp; K: safflower; L: pumpkin seed; and M: rice.
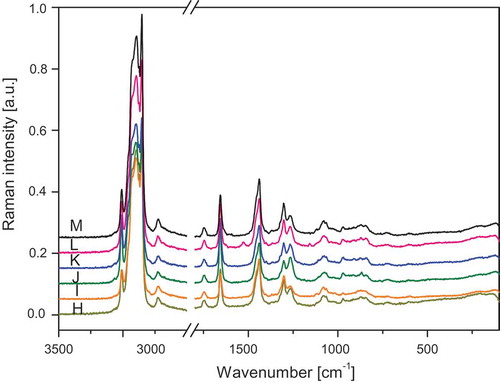
Figure 5. The relationship between the iodine value and integral intensity ratio of IR bands at about 1655/2852 cm−1 of oils: A: hazel; B: sunflower; C: avocado; D: rice; E: rapeseed; F: roasted sesame; G: pumpkin seed; H: corn; I: walnut; J: safflower; K: hemp; L: low-linolenic flax; and M: high-linolenic flax.
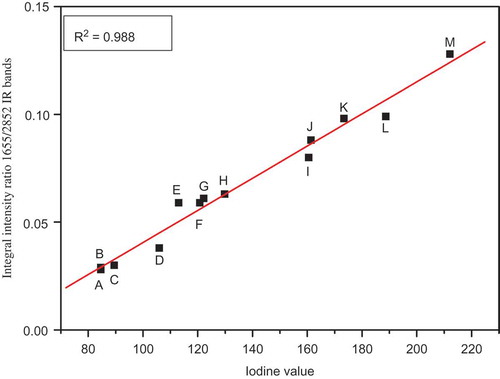
Figure 6. The relationship between the iodine value and integral intensity ratio of Raman bands at about 1655/2850 cm−1 of oils: A: hazel; B: sunflower; C: avocado; D: rice; E: rapeseed; F: roasted sesame; G: pumpkin seed; H: corn; I: walnut; J: safflower; K: hemp; L: low-linolenic flax; and M: high-linolenic flax.
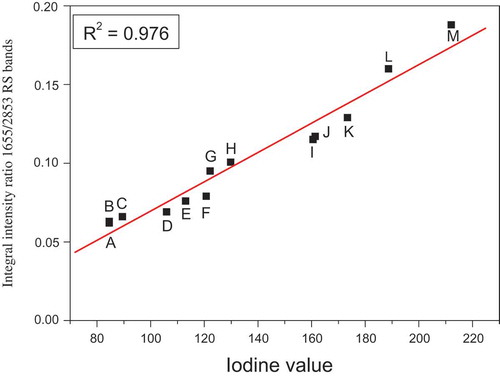
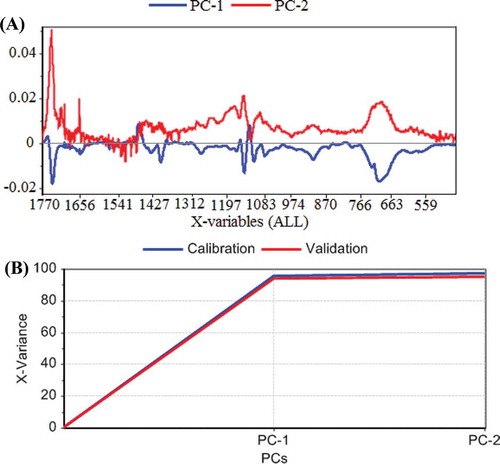
Figure 7. The results of the PCA analysis. A: Loading from the first (PC-1) and second (PC-2) principal components of ATR-FTIR obtained for the studied oils; B: Explained variance from the PCs model.