Figures & data
Table 1. Chemical structures of seven chlorogenic acids.
Table 2. The relative response factors of seven chlorogenic acids.
Table 3. Contents (%) of seven chlorogenic acids in samples of green coffee bean extractsc.
Figure 1. Representative HPLC chromatograms. a: Working reference standards solution; b: Sample solution of GCBE (1) 3-CQA, (2) 5-CQA, (3) 4-CQA, (4) 5-FQA, (5) 3,4-diCQA, (6) 3,5-diCQA, (7) 4,5-diCQA.
Table 4. Liner range, liner equation, R2, limit of detection (LOD) and limit of quantification (LOQ).
Table 5. The relative standard deviation of the precision and repeatability of each standard.
Table 6. Recoveries and relative standard deviations (RSD) of standard compounds (n=3).
Table 7. The results of two-way ANOVA to relative response factors.
Figure 2. Residual plots for F3–CQA.
Table 8. The response tables for signal to noise ratios, means and standard deviations. Nominal is best (10*Log10(Ybar**2/s**2)).
Figure 3. Main effects plots for signal-to-noise ratios (SN ratios), means, and standard deviations (SDs).
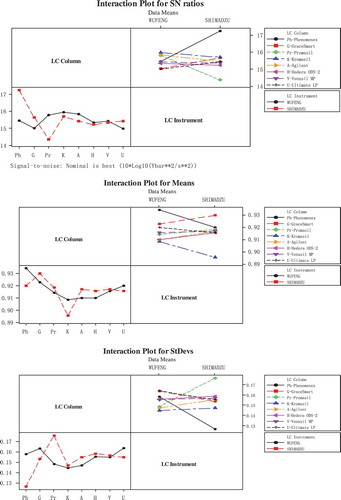
Figure 4. Interaction plots for signal-to-noise ratios (SN ratios), means, and standard deviations (SDs).