6,209
Views
28
CrossRef citations to date
0
Altmetric
Articles

Comparative study of potato protein concentrates extracted using ammonium sulfate and isoelectric precipitation

, , , &
Pages 2113-2127 | Received 30 Jun 2016, Accepted 27 Aug 2016, Published online: 19 Jan 2017

Figures & data

Table 1. The proximate composition of potato protein (g/100 g sample).

Figure 1. SDS–PAGE patterns of ASPP and IEPP. Lanes 1–5 were marker, ASPP, IEPP, ASPP in present of β-mercaptoethanol, and IEPP in present of β-mercaptoethanol, respectively.

Figure 1. SDS–PAGE patterns of ASPP and IEPP. Lanes 1–5 were marker, ASPP, IEPP, ASPP in present of β-mercaptoethanol, and IEPP in present of β-mercaptoethanol, respectively.

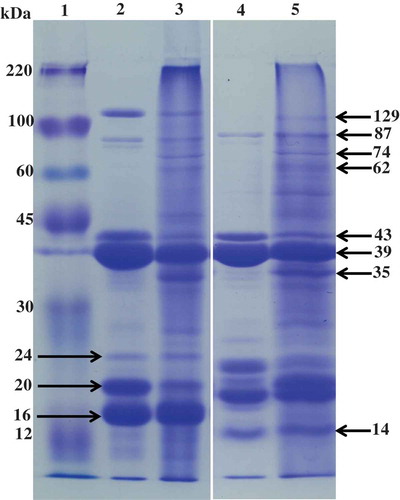
Table 2. Color values and total polyphenol content of ASPP and IEPP.

Figure 2. Effect of NaCl concentration (M) (A) and pH (B) on the solubility (%) of ASPP and IEPP. Values in the same graph with the different letter are significantly different (p < 0.05).

Figure 2. Effect of NaCl concentration (M) (A) and pH (B) on the solubility (%) of ASPP and IEPP. Values in the same graph with the different letter are significantly different (p < 0.05).

Figure 3. Effect of NaCl concentration (M) and pH on the emulsifying properties of ASPP and IEPP. Effect of NaCl concentration (M) (A) and pH (B) on the EAI (mCitation2/g). Effect of NaCl concentration (M) (C) and pH (D) on the ESI (mCitation2/g). Values in the same graph with the different letter are significantly different (p < 0.05).

Figure 3. Effect of NaCl concentration (M) and pH on the emulsifying properties of ASPP and IEPP. Effect of NaCl concentration (M) (A) and pH (B) on the EAI (mCitation2/g). Effect of NaCl concentration (M) (C) and pH (D) on the ESI (mCitation2/g). Values in the same graph with the different letter are significantly different (p < 0.05).

Table 3. Effect of NaCl concentration (M) (A) and pH (B) on the foaming stability of ASPP and IEPP.

Table 4. Amimo acid composition and nutritional value of ASPP and IEPP.

Figure 4. Effect of NaCl concentration (M) (A) and pH (B) on the foaming ability (%) of ASPP and IEPP. Values in the same graph with the different letter are significantly different (p< 0.05).

Figure 4. Effect of NaCl concentration (M) (A) and pH (B) on the foaming ability (%) of ASPP and IEPP. Values in the same graph with the different letter are significantly different (p< 0.05).

Figure 5. Effect of NaCl concentration (M) (A) and pH (B) on the endothermic peak of ASPP. Effect of NaCl concentration (M) (C) and pH (D) on the endothermic peak of IEPP. Arrows point to the heat absorption peak.

Figure 5. Effect of NaCl concentration (M) (A) and pH (B) on the endothermic peak of ASPP. Effect of NaCl concentration (M) (C) and pH (D) on the endothermic peak of IEPP. Arrows point to the heat absorption peak.

Reprints and Corporate Permissions

Please note: Selecting permissions does not provide access to the full text of the article, please see our help page How do I view content?

To request a reprint or corporate permissions for this article, please click on the relevant link below:

Academic Permissions

Please note: Selecting permissions does not provide access to the full text of the article, please see our help page How do I view content?

Obtain permissions instantly via Rightslink by clicking on the button below:

If you are unable to obtain permissions via Rightslink, please complete and submit this Permissions form. For more information, please visit our Permissions help page.