
Figures & data
Table 1. Wine sample information.
Figure 1. Anthocyanidin A: and acylation; and B: percentages of total anthocyanins in different wine samples.
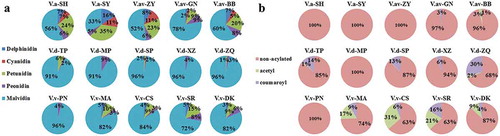
Table 2. Concentrations (mg/L) of 57 quantified phenolic compounds in different wine samples.
Table 3. Chromatic parameters of different wine samples.
Figure 2. PCA differentiation of phenolic compounds in different wine products according to their phenolic percentages.
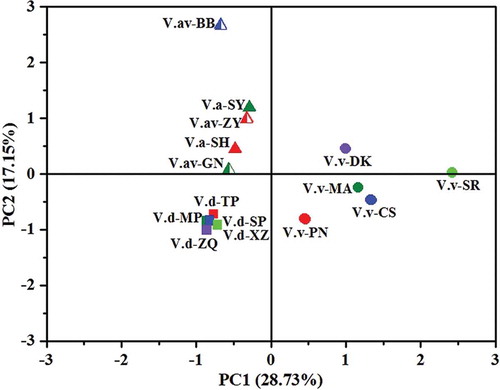
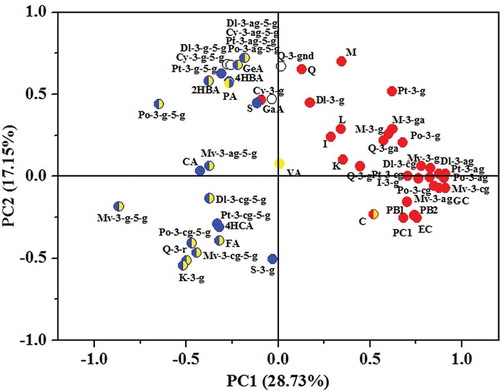
Figure 3. Loading plots of different phenolic compounds in PC1 and PC2. A colored phenolic spot meant that the phenolic compound was positively correlated with its painted color.
Supplemental material