Figures & data
Table 1. Assignments of signals of 1H-NMR spectra from samples. Signal number agrees with those in .
Figure 1. 1H-NMR spectra of A: pure lard; and B: pure butter.
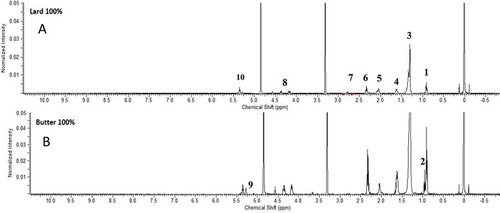
Figure 2. 1H-NMR spectra of butter and lard mixtures showing changes in the height ratio at 2.60–2.84 ppm due to the increase of lard percentages at 0 to 10 ppm.
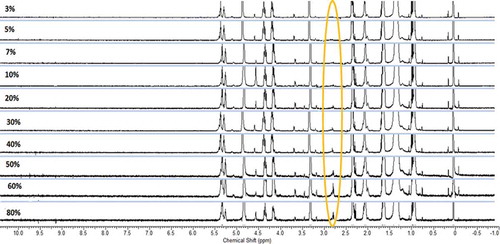
Table 2. Fatty acid composition of butter and lard by gas chromatography mass spectrometry analysis.
Table 3. Triacylglycerol (TAG) composition of lard, butter, and other animal fats.
Figure 3. 13C nuclear magnetic resonance (NMR) spectrum of lard.
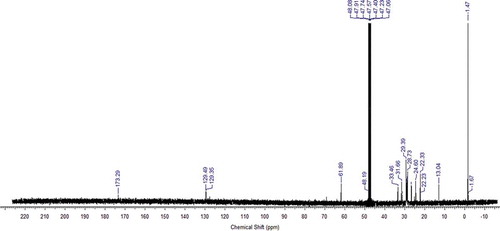
Figure 4. Heteronuclear multiple bonds correlation (HMBC) spectrum of lard.
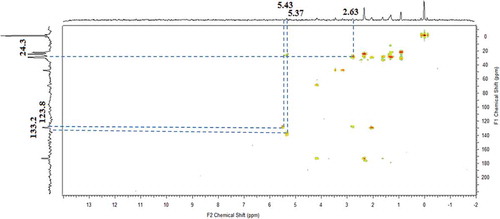
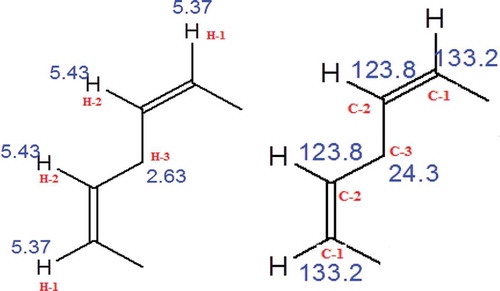
Figure 5. Structural correlation between proton and carbon.