
Figures & data
Table 1. The changes of moisture indexes in mandarin fish fermentation.
Table 2. The correlation of moisture indexes.
Table 3. Changes in distributions of T2 relaxation time in the stinky mandarin fish fermentation.
Table 4. Changes of groups moisture in the stinky mandarin fish fermentation.
Figure 1. Changes in distributions of T2 relaxation time in the stinky mandarin fish fermentation.
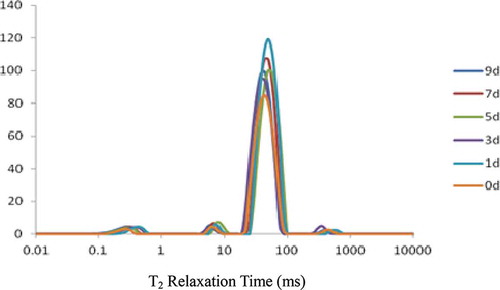
Figure 2. (A) Changes of hardness and chewiness in the stinky mandarin fish fermentation. (B) Changes of cohesiveness, springiness, and resilience in the stinky mandarin fish fermentation. (C) Changes of adhesiveness in the stinky mandarin fish fermentation. (D) Changes of gumminess in the stinky mandarin fish fermentation.
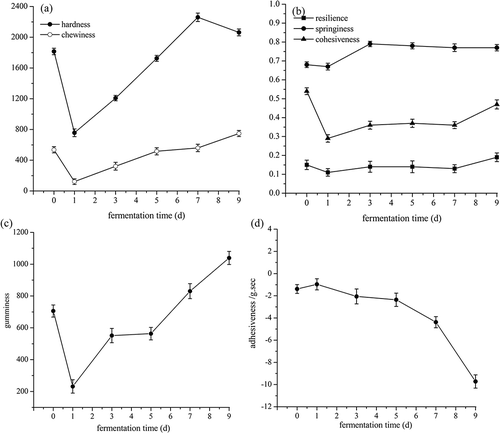
Table 5. The correlation of between T2 relaxation time and texture.