1,638
Views
3
CrossRef citations to date
0
Altmetric
Original Articles

Structural characteristics of Sheldrake meat and secondary structure of myofibrillar protein: effects of oxidation

, , &
Pages 1553-1566 | Received 12 Jul 2016, Accepted 05 Nov 2016, Published online: 22 Dec 2017

Figures & data

Table 1. L*, a*, and b* value of non-oxidized and oxidized Sheldrake breast muscle.

Figure 1. WHC (a), shear force (b), and TBARS value (c) of non-oxidized and oxidized Sheldrake breast muscle.
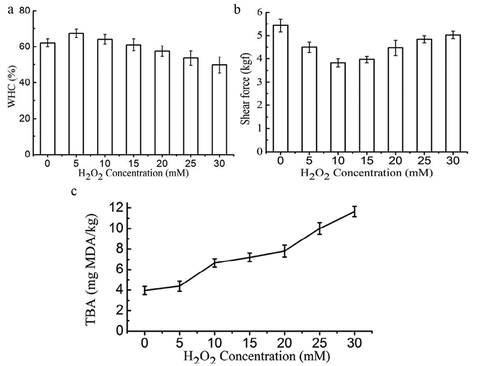
Figure 1. WHC (a), shear force (b), and TBARS value (c) of non-oxidized and oxidized Sheldrake breast muscle.

Figure 2. Protein carbonyls (a), sulfhydryl group contents (b), and the surface hydrophobicity (c) of non-oxidized and oxidized MP.
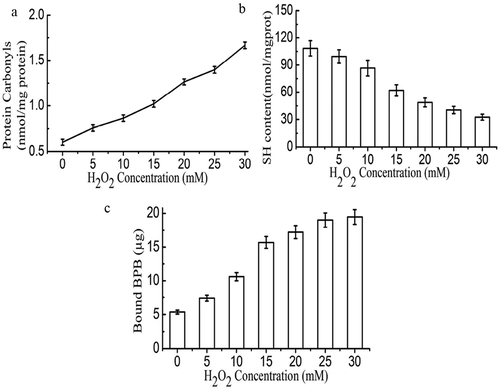
Figure 2. Protein carbonyls (a), sulfhydryl group contents (b), and the surface hydrophobicity (c) of non-oxidized and oxidized MP.

Figure 3. WHC (a) and textural properties (b) of non-oxidized and oxidized MP gels.

Figure 3. WHC (a) and textural properties (b) of non-oxidized and oxidized MP gels.

Figure 4. Raman spectra (500–550 cm–1 region) of non-oxidized (a) and oxidized MP gels treated with different HRGS (5 mM H2O2 (b); 10 mM H2O2 (c); 15 mM H2O2 (d); 20 mM H2O2 (e); 25 mM H2O2 (f); 30 mM H2O2 (g)).
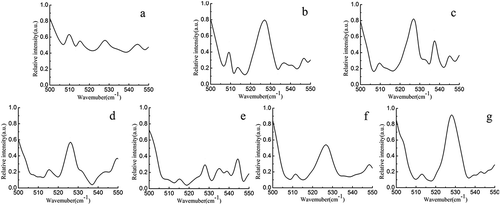
Figure 4. Raman spectra (500–550 cm–1 region) of non-oxidized (a) and oxidized MP gels treated with different HRGS (5 mM H2O2 (b); 10 mM H2O2 (c); 15 mM H2O2 (d); 20 mM H2O2 (e); 25 mM H2O2 (f); 30 mM H2O2 (g)).
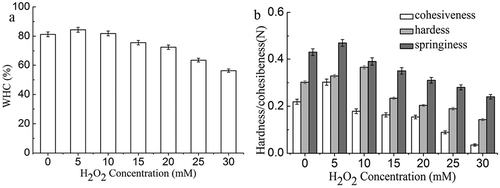
Figure 5. Deconvoluted and curve-fitted Raman bands of amide I of (a) and oxidized MP gels treated with different HRGS (5 mM H2O2 (b); 10 mM H2O2 (c); 15 mM H2O2 (d); 20 mM H2O2 (e); 25 mM H2O2 (f); 30 mM H2O2 (g)).
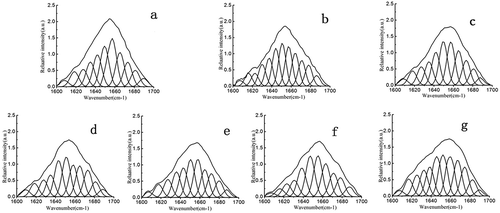
Figure 5. Deconvoluted and curve-fitted Raman bands of amide I of (a) and oxidized MP gels treated with different HRGS (5 mM H2O2 (b); 10 mM H2O2 (c); 15 mM H2O2 (d); 20 mM H2O2 (e); 25 mM H2O2 (f); 30 mM H2O2 (g)).
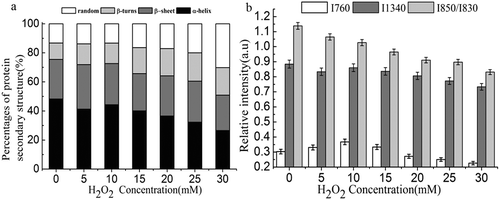
Figure 6. Relative content of the protein secondary structures (a) and normalized bands intensity (760 and 1340 cm–1) and I850/I830 intensity ratio (b) of non-oxidized and oxidized MP gel.

Figure 6. Relative content of the protein secondary structures (a) and normalized bands intensity (760 and 1340 cm–1) and I850/I830 intensity ratio (b) of non-oxidized and oxidized MP gel.
Supplemental material

LJFP_A_1258573_Supplementary_Grapgic.zip

Download Zip (651.9 KB)

Reprints and Corporate Permissions

Please note: Selecting permissions does not provide access to the full text of the article, please see our help page How do I view content?

To request a reprint or corporate permissions for this article, please click on the relevant link below:

Academic Permissions

Please note: Selecting permissions does not provide access to the full text of the article, please see our help page How do I view content?

Obtain permissions instantly via Rightslink by clicking on the button below:

If you are unable to obtain permissions via Rightslink, please complete and submit this Permissions form. For more information, please visit our Permissions help page.