
Figures & data
Scheme 1. The glassy carbon electrode was coated with AuNPs (AuNP—GCE). A specific ssDNA probe of aflD gene was immobilized on AuNP–GCE. In the absence of the target DNA, the flexible ssDNA probe supports efficient contact between the [Fe(CN)6]3−/4− reducer and AuNP—GCE, there is a low electron transfer resistance (Ret) of the electrochemical DNA sensor. After the hybridization, a rigid probe-target duplex is formed which contact between the [Fe(CN)6]3−/4− reducer and AuNP—GCE was prevented. This leads to an increasing in the Ret of the electrochemical DNA sensor.
![Scheme 1. The glassy carbon electrode was coated with AuNPs (AuNP—GCE). A specific ssDNA probe of aflD gene was immobilized on AuNP–GCE. In the absence of the target DNA, the flexible ssDNA probe supports efficient contact between the [Fe(CN)6]3−/4− reducer and AuNP—GCE, there is a low electron transfer resistance (Ret) of the electrochemical DNA sensor. After the hybridization, a rigid probe-target duplex is formed which contact between the [Fe(CN)6]3−/4− reducer and AuNP—GCE was prevented. This leads to an increasing in the Ret of the electrochemical DNA sensor.](/cms/asset/0a3ac7f5-19a9-4232-9fe3-c4f07638532e/ljfp_a_1291675_sch0001_oc.jpg)
Table 1. DNA probe, target, and primers.
Figure 1. Agarose gel electrophoresis of PCR product. ((af): PCR product of A. flavus. (bf): PCR product of contaminated pistachio. (cf): control experiment without any genes).
Figure 2. a. Cyclic voltammograms of bare electrode and AuNP electrodeposited electrode (potential scanning: −0.2–0.6 V, Scan rate: 50 mV s−1, in 10 mM [Fe(CN)6]3−/4−). b. Cyclic voltammogram recorded at AuNP–GCE (potential scanning: −0.2–1.6 V, Scan rate: 50 mV s−1, N = 10, in 0.1 M NaNO3 aqueous solution with 0.25 mM HAuCl4 · 3H2O and 0.01 M H2SO4).
![Figure 2. a. Cyclic voltammograms of bare electrode and AuNP electrodeposited electrode (potential scanning: −0.2–0.6 V, Scan rate: 50 mV s−1, in 10 mM [Fe(CN)6]3−/4−). b. Cyclic voltammogram recorded at AuNP–GCE (potential scanning: −0.2–1.6 V, Scan rate: 50 mV s−1, N = 10, in 0.1 M NaNO3 aqueous solution with 0.25 mM HAuCl4 · 3H2O and 0.01 M H2SO4).](/cms/asset/77a86c30-36a5-4f91-91bb-c1708cccf791/ljfp_a_1291675_f0002_oc.jpg)
Figure 3. SEM images of AuNP–GCE provided by electrodeposition from a 0.1 M NaNO3 aqua solution with 0.25 mM HAuCl4·3H2O and 0.01 M H2SO4.
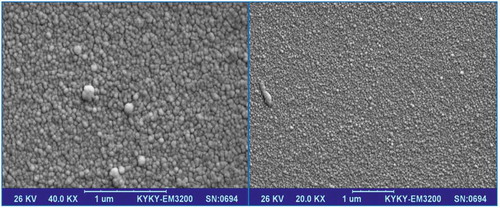
Figure 4. EIS of different modified electrode. (EIS was performed in a base solution of 10 mM [Fe(CN)6]3−/4− with 0.1 M KCl and 0.1 M PBS buffer pH 7.4. EIS was registered in the frequency ranging from 0.1 to 105 Hz at a constant potential EIS of 150 mV with an alternating voltage of 10 mV).
![Figure 4. EIS of different modified electrode. (EIS was performed in a base solution of 10 mM [Fe(CN)6]3−/4− with 0.1 M KCl and 0.1 M PBS buffer pH 7.4. EIS was registered in the frequency ranging from 0.1 to 105 Hz at a constant potential EIS of 150 mV with an alternating voltage of 10 mV).](/cms/asset/a8ac7f25-b609-4747-b4ff-6ca95d0de4a9/ljfp_a_1291675_f0004_oc.jpg)
Figure 5. EIS of different incubation time of probe. (EIS was performed in a base solution of 10 mM [Fe(CN)6]3−/4− with 0.1 M KCl and 0.1 M PBS buffer pH 7.4. EIS was registered in the frequency ranging from 0.1 to 105 Hz at a constant potential EIS of 150 mV with an alternating voltage of 10 mV).
![Figure 5. EIS of different incubation time of probe. (EIS was performed in a base solution of 10 mM [Fe(CN)6]3−/4− with 0.1 M KCl and 0.1 M PBS buffer pH 7.4. EIS was registered in the frequency ranging from 0.1 to 105 Hz at a constant potential EIS of 150 mV with an alternating voltage of 10 mV).](/cms/asset/c4c3f7ef-32f5-4484-bc72-6ec130eceb11/ljfp_a_1291675_f0005_oc.jpg)
Figure 6. EIS of different incubation time of hybridization. (EIS was performed in a base solution of 10 mM [Fe(CN)6]3−/4− with 0.1 M KCl and 0.1 M PBS buffer pH 7.4. EIS was registered in the frequency ranging from 0.1 to 105 Hz at a constant potential EIS of 150 mV with an alternating voltage of 10 mV).
![Figure 6. EIS of different incubation time of hybridization. (EIS was performed in a base solution of 10 mM [Fe(CN)6]3−/4− with 0.1 M KCl and 0.1 M PBS buffer pH 7.4. EIS was registered in the frequency ranging from 0.1 to 105 Hz at a constant potential EIS of 150 mV with an alternating voltage of 10 mV).](/cms/asset/bfe90dca-b7bb-4da6-b298-a5e1db414c4a/ljfp_a_1291675_f0006_oc.jpg)
Figure 7. EIS of hybridization process at a different concentration of DNA target. (a) probe; (b) 0.001 µM; (c) 0.005 µM; (d) 0.01 µM; (e) 0.05 µM; (f) 0.1 µM; (g) 1.0 µM; (h) 10 µM. (EIS was performed in a base solution of 10 mM [Fe(CN)6]3−/4− with 0.1 M KCl and 0.1 M PBS buffer pH 7.4. EIS was registered in the frequency ranging from 0.1 to 105 Hz at a constant potential EIS of 150 mV with an alternating voltage of 10 mV).
![Figure 7. EIS of hybridization process at a different concentration of DNA target. (a) probe; (b) 0.001 µM; (c) 0.005 µM; (d) 0.01 µM; (e) 0.05 µM; (f) 0.1 µM; (g) 1.0 µM; (h) 10 µM. (EIS was performed in a base solution of 10 mM [Fe(CN)6]3−/4− with 0.1 M KCl and 0.1 M PBS buffer pH 7.4. EIS was registered in the frequency ranging from 0.1 to 105 Hz at a constant potential EIS of 150 mV with an alternating voltage of 10 mV).](/cms/asset/7c6a8b09-aa3f-47ee-944c-265fe944abdb/ljfp_a_1291675_f0007_oc.jpg)
Figure 8. EIS of PCR product. (af): PCR product of Aspergillus flavus. (bf): PCR product of contaminated pistachio. (cf): control experiment, without any genes. (R): random 76-mer sequence. (EIS was performed in a base solution of 10 mM [Fe(CN)6]3−/4− with 0.1 M KCl and 0.1 M PBS buffer pH 7.4. EIS was registered in the frequency ranging from 0.1 to 105 Hz at a constant potential EIS of 150 mV with an alternating voltage of 10 mV).
![Figure 8. EIS of PCR product. (af): PCR product of Aspergillus flavus. (bf): PCR product of contaminated pistachio. (cf): control experiment, without any genes. (R): random 76-mer sequence. (EIS was performed in a base solution of 10 mM [Fe(CN)6]3−/4− with 0.1 M KCl and 0.1 M PBS buffer pH 7.4. EIS was registered in the frequency ranging from 0.1 to 105 Hz at a constant potential EIS of 150 mV with an alternating voltage of 10 mV).](/cms/asset/d3c122cd-8ab4-4852-8f9d-7a4b669170be/ljfp_a_1291675_f0008_oc.jpg)