Figures & data
Figure 1. Record of temperatures in chicken soups cooked at 103 °C (♦) and 85 °C (■) for 5 h.
Table 1. Amino acid content (nmol µL−Citation1) in chicken soups cooked at different combinations of temperature (T) and time (t).
Figure 2. GC-FID separation* of amino acids after preparation and derivatisation with the EZfaast kit.
*Photograph of chromatogram.a:alanine; b:sarcosine; c:glycine; d:homoalanine; e:valine; f:ß-aminoisobutiric acid; g:internal standard; h:leucine; i:allo-isoleucine; j:isoleucine; k:threonine; l:serine; m:proline; n:asparagine; o:aspartic acid; p:methionine; q:glutamic acid; r:phenilalanine; s:α-aminoadipic acid; t:glutamine; u:ornithine; v:lysine; w:histidine; x:tyrosine; y: tryptophan; z:cystine.
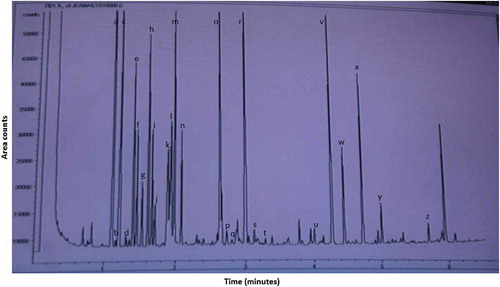
Table 2. Nucleotide content (g/Kg) in chicken soups cooked at different combinations of temperature (T) and time (t).
Figure 3. Equivalent umami concentration (EUC) in chicken soups cooked at 103°C (♦) and 85°C (■) for 3, 4, and 5 h.
Different letters indicate significant differences between batches.
Figure 4. Results on sensory analysis of chicken soups cooked at different temperatures and times.
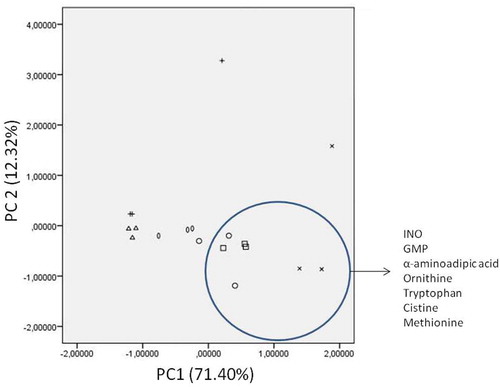
Figure 5. Score plot of principal component analysis of chicken soups cooked at different combination of temperature and time (85°C-3 h: Δ, 85°C-4 h: +, 85°C-5 h: 0, 103°C-3 h: ◯, 103°C-4 h: ⁏, 103°C-5 h: X).