Figures & data
Figure 1. Method of taking a sample for the study.
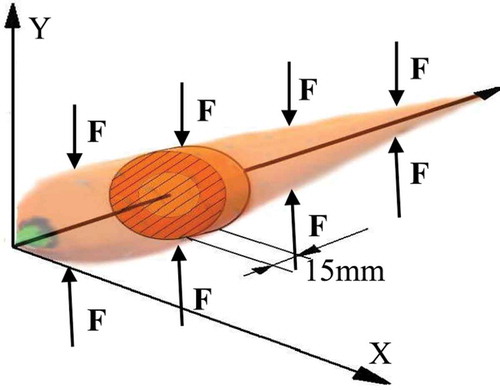
Figure 2. Geometrical disc-type model – the load and the boundary conditions.
Table 1. Parameters used to the FEM model building - COSMOS/M.
Figure 3. Geometrical disc-type model – the load and the boundary conditions.
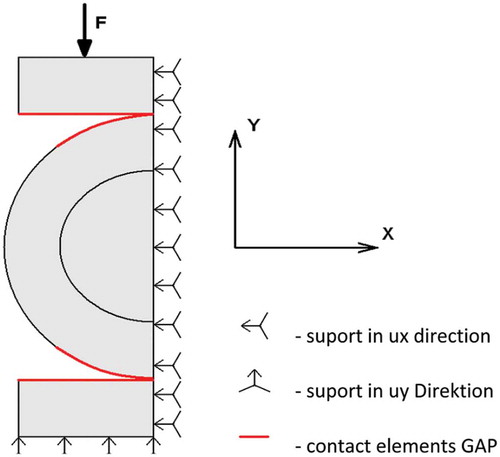
Figure 4. Optical system for measurement of displacement using ESPI.
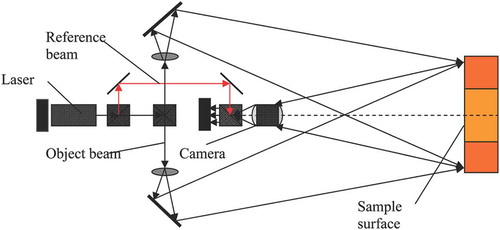
Figure 5. (a) Real object – measurement of ESPI (b) Disc model – MES. Contours of uy displacement obtained during the contact with the flat l1 = 3 mm.
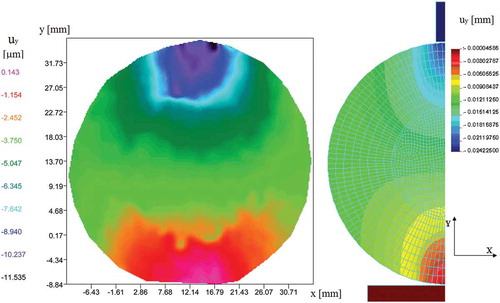
Figure 6. The uy displacement distributions in the Y direction obtained during the contact with a flat l1 = 3 mm.
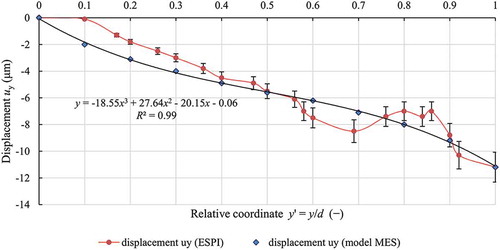
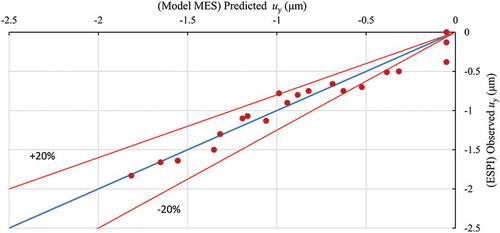
Figure 7. Dispersion of the obtained results of the displacement uy (ESPI) in comparison to the predicted FEM values, during the contact with the flat l1 = 3 mm in width.
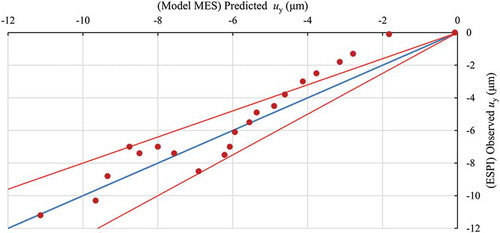
Figure 8. (a) Real object – measurement of ESPI (b) Membrane model – FEM Contours of uy displacements obtained during the contact with the flat l2 = 7 mm in width being under load.
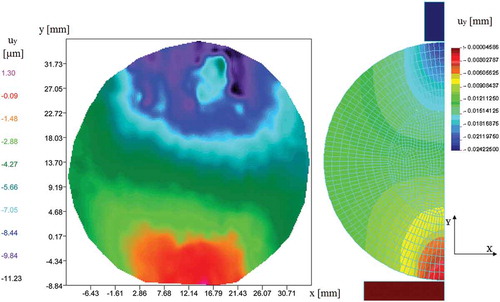
Figure 9. Distributions of displacements uy in the Y direction obtained during contact with a flat (l2 = 7 mm in width).
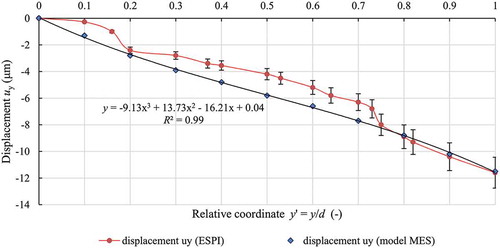
Figure 10. Dispersion of the measured values of the displacement uy (ESPI) compared to the predicted values FEM during contact with a flat (l1 = 7 mm in width).
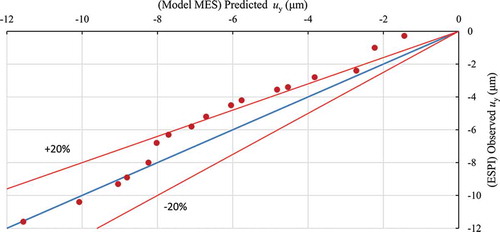
Figure 11. Contours of uy displacements obtained during the contact with the flat l2 = 7 mm in width being under load.
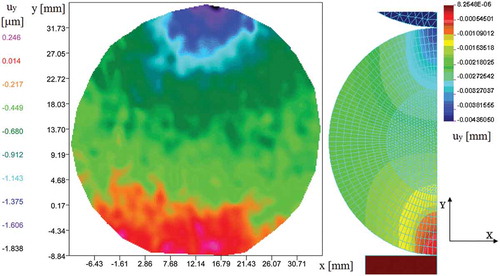
Table 2. Comparison of displacement distributions uy in the direction of the Y axis ().
Table 3. The comparison of displacement distributions uy in the direction of Y axis ().
Figure 12. Displacement distributions uy in the direction of Y axis obtained during the contact with cylindrical element of R = 28 mm.
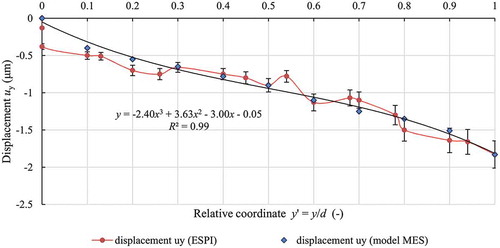
Table 4. The comparison of displacement distributions uy in the direction of Y axis ().
Figure 13. Dispersion of measured displacement uy values (ESPI) in the comparison to the predicted MES model values during the contact with cylindrical loading element of R = 28 mm.