Figures & data
Figure 1. (a) Rheometer Haake model VT550 with a concentric cylinder system, (b) mango pulp, and (c) rheometer operation scheme Haake Viscotester.
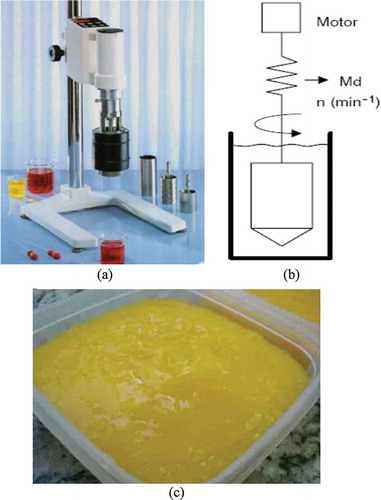
Figure 2. Mango pulp rheograms at temperatures from 20°C to 40°C.
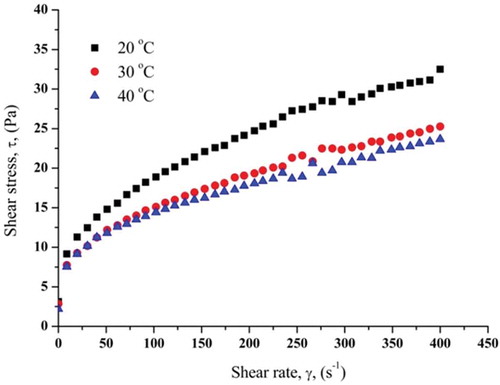
Figure 3. Normalized sensitivity coefficients at: (a) 20°C, (b) 30°C, and (b) 40ºC.
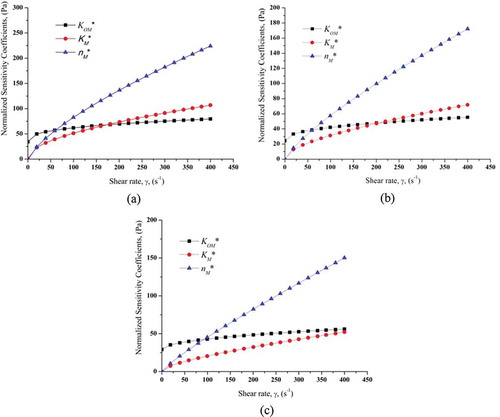
Figure 4. Ratio between the normalized sensitivity coefficients at: (a) 20°C, (b) 30°C, and (b) 40ºC.
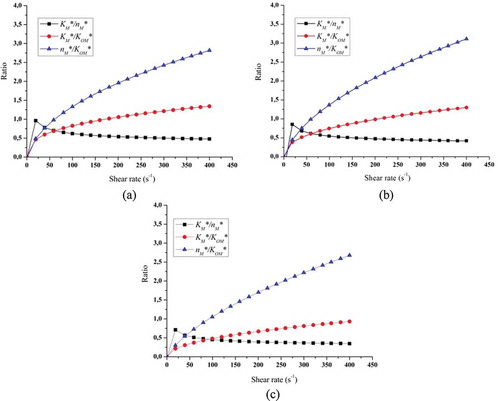
Table 1 Rheological parameters estimated by the Levenberg–Marquardt method.
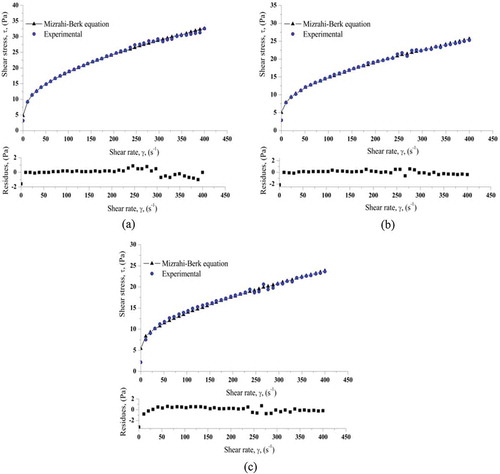
Figure 5. Reogrames (experimental and calculated from the Mizrahi–Berk equation) and residues at: (a) 20°C, (b) 30°C, and (c) 40°C.