Figures & data
Figure 1. Extraction and characterizations of SHDPs produced by H. dulcis. (A) The HPLC spectrum of SHDPs; (B) UV spectra of SHDPs; (C) DEAE-cellulose chromatography of polysaccharide from spent H. dulcis.
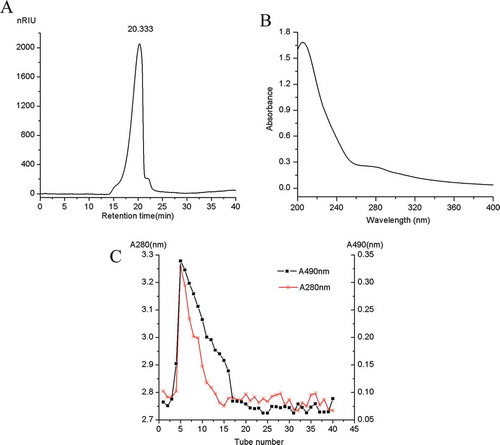
Figure 2. GC chromatograms. (A) SHDPs; (B) monosaccharides reference; (C) fraction of partial acid hydrolysis. Peak: (1) L-rhamnose, (2) D-fucose, (3) L-arabinose, (4) D-xylose, (5) D-mannose, (6) D-glucose, and (7) D-galactose.
Figure 3. FTIR spectra. (A) SHDPs; (B) methylated SHDPs.
Table 1. Methylation analysis of SHDPs.
Figure 4. NMR spectra of SHDPs. (A) Citation1H NMR spectrum of SHDPs; (B) Citation13C NMR spectrum of SHDPs.
Figure 5. Antioxidant activities of SHDPs in vitro. (A) DPPH radical scavenging activity; (B) ABTS radical scavenging activity; (C) FeCitation2+ chelating ability; (D) superoxide radical scavenging activity. Values are means±SD, n = 3. (E) ADH activity. a: p ﹤ 0.05; b: p ﹤ 0.01 versus positive control.
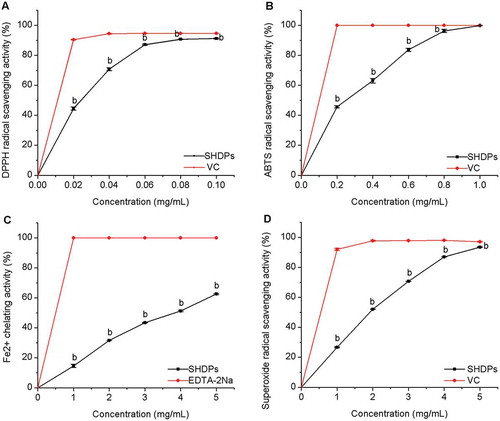
Figure 6. Effect of SHDPs on ADH activity. a: p ﹤ 0.05; b: p ﹤ 0.01 versus blank control.