
Figures & data
Figure 1. (a) Theoretical Cole impedance model to represent experimentally collected data from biological tissues. (b) Simple circuit to collect magnitude response using Cole impedance as a component.
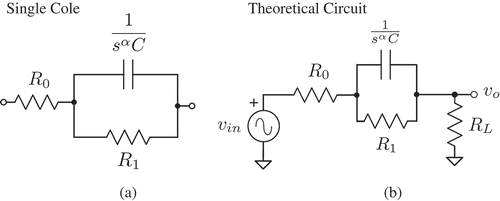
Figure 2. Experimental test setup to collect magnitude response using Agilent 4395A network analyzer when an apple is used as a component in a simple filter circuit.
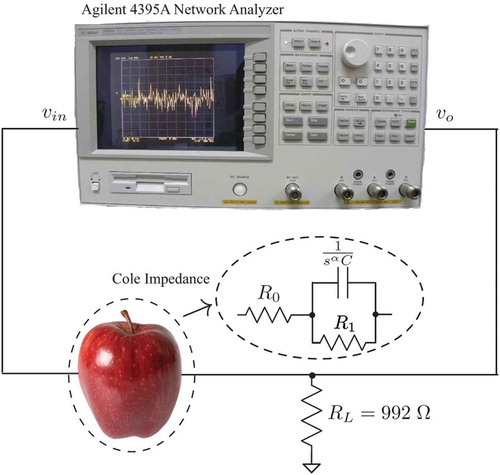
Figure 3. Top and side views of electrodes placed into apples for collection of magnitude responses.
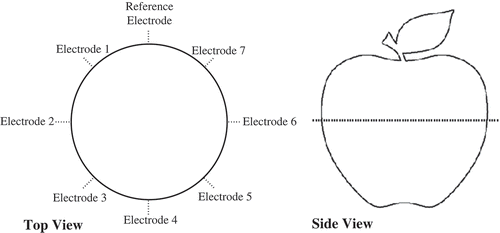
Figure 4. (a) Granny Smith, (b) Fuji, (c) Red Delicious, and (d) Spartan varieties of apples.
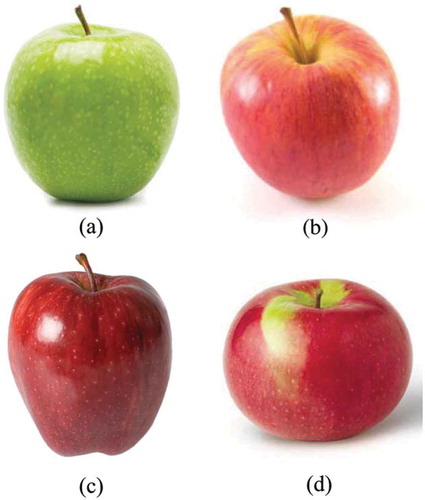
Figure 5. Magnitude responses collected from a single (a) Granny Smith, (b) Fuji, (c) Red delicious, and (d) Spartan varieties of apples using different electrode configurations.
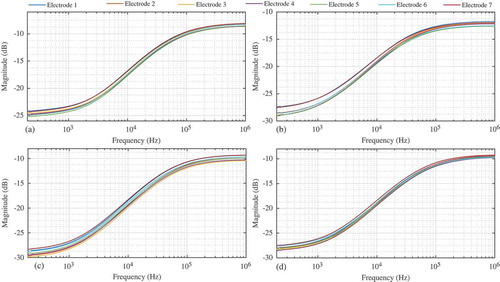
Table 1. LSE and circuit models parameters determined applying NLSF to magnitude responses of Granny Smith, Fuji, Red Delicious, and Spartan apple.
Figure 6. Comparison of experimental magnitude response (black) collected from Red Delicious electrode 1 configuration and MATLAB simulation using extracted parameters (gray circles).
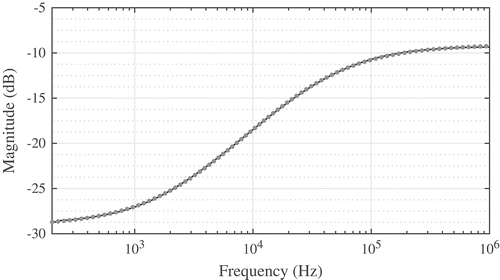
Figure 7. Error using equivalent circuit parameters compared to experimental magnitude response from (a) Granny Smith, (b) Fuji, (c) Red Delicious, and (d) Spartan varieties of apples.
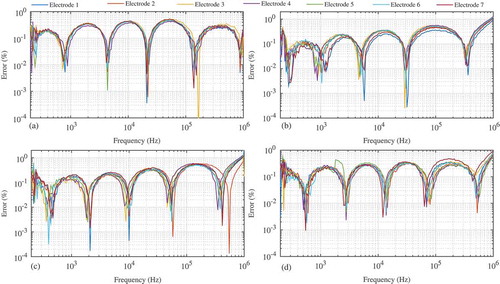
Figure 8. Boxplots of extracted (a) R0, (b) R1, (c) C, (d) α for each electrode pair of all varieties of apples.
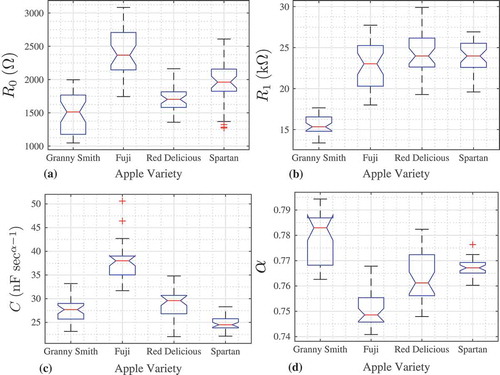
Table 2. Average and standard deviation of parameters from Granny Smith, Fuji, Red Delicious, and Spartan apples.
Table 3 Average, standard deviation, and coefficient of variation (%) of parameters from Granny Smith, Fuji, Red Delicious, and Spartan apples.