
Figures & data
Figure 1. (a) pH and (b) Conductivity of Lime emulsions oils.
Figure 2. Size distributions of emulsions. (a) GA; (b) GA/WPI; (c) WPI; (1) 0 h and (2) after 4 h.
Figure 3. Microscopy images of emulsions prepared with GA and different essential oil concentration: (a) 5.0 g oil/100 g emulsion; (b) 7.5 g oil/100 g emulsion; (c) 10.0 g oil/100 g emulsion; (1) fresh and (2) after 4 h.
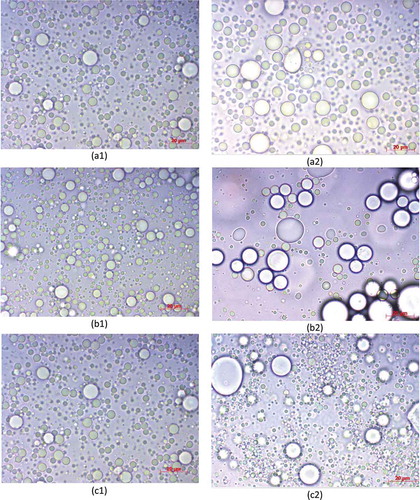
Figure 4. Apparent viscosity as function of shear rate for lime essential oil with GA (A), GA/WPI (B) e WPI (C).
Figure 5. Creaming index to lime essential oil emulsions after 4 h.
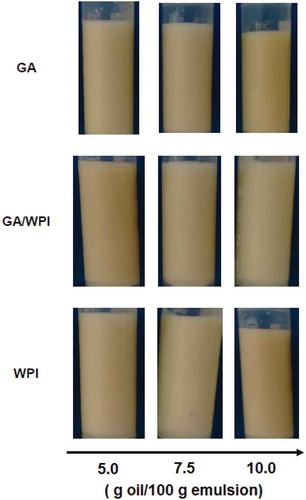
Table 1. Experimental design to lime essential oil emulsions.
Table 2. Zeta potential by biopolymers solutions and emulsions at 0 and 4 h.
Table 3. Polydispersion index (PDI) and droplet size by emulsions at 0 and 4 hours.
Table 4. Correlation coefficient, residual mean square and Power Law model parameters for emulsions prepared with different biopolymers and lime essential oil.
Table 5. Apparent viscosity values at 100 s−Citation1.