11,591
Views
28
CrossRef citations to date
0
Altmetric
Original Articles

Thermal conductivity of ice prepared under different conditions

, & ORCID Icon
Pages 610-619 | Received 06 Oct 2016, Accepted 10 Mar 2017, Published online: 05 Jul 2017

Figures & data

Table 1. Thermal conductivity k of ice as a function of temperature from literature reports.[Citation3Citation7].

Figure 1. a) Temperature vs. time, b) ΔT vs. ln(t) and c) T vs. ln(t/(t-th)) data obtained at −10 °C with th = 1 min.

Figure 1. a) Temperature vs. time, b) ΔT vs. ln(t) and c) T vs. ln(t/(t-th)) data obtained at −10 °C with th = 1 min.

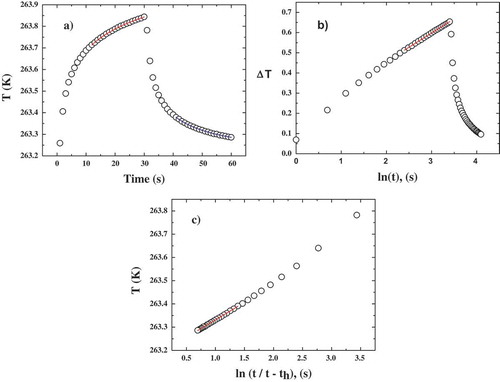
Table 2. Thermal conductivity, k, from the NLLSA and the LLSA of Eqs. 1 and 2 at different heating times, th.

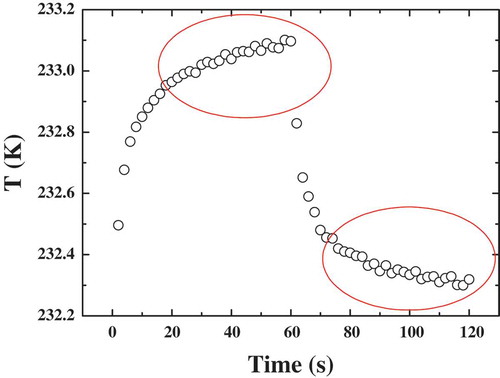
Table 3. Thermal conductivity, k, of solid water (ice) at temperatures ranging from −40 to −5 ºC obtained by using different heating time.

Figure 2. Temperature vs. time data obtained at −40 °C with th = 2 min.

Figure 2. Temperature vs. time data obtained at −40 °C with th = 2 min.

Figure 3. Experimental thermal conductivities of ice reported in the literature and obtained for the different freezing processes in this study.

Figure 3. Experimental thermal conductivities of ice reported in the literature and obtained for the different freezing processes in this study.

Reprints and Corporate Permissions

Please note: Selecting permissions does not provide access to the full text of the article, please see our help page How do I view content?

To request a reprint or corporate permissions for this article, please click on the relevant link below:

Academic Permissions

Please note: Selecting permissions does not provide access to the full text of the article, please see our help page How do I view content?

Obtain permissions instantly via Rightslink by clicking on the button below:

If you are unable to obtain permissions via Rightslink, please complete and submit this Permissions form. For more information, please visit our Permissions help page.