Figures & data
Table 1. Safranal quantification for different saffron samples using UV–visible spectroscopy
Figure 1. Schematic representation of the developed technique for saffron aroma characterization.
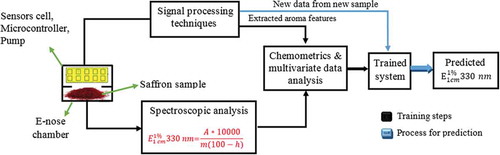
Figure 2. PCA score plot for the characterization of 33 saffron samples having different aroma strengths.
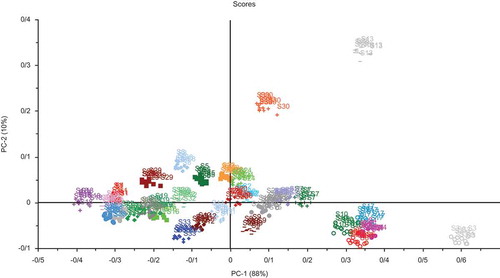
Figure 3. Relative contribution of the used aroma features to each PC (the loading plot).
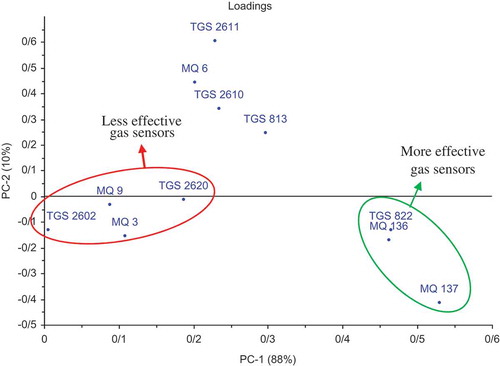
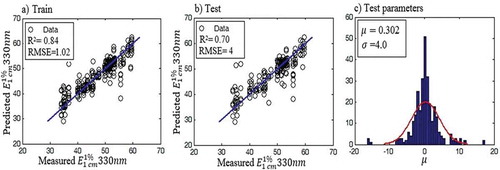
Figure 4. MLP model A-correlations between the predicted and actual values, from left to right: training, validation, and test sets (data of all the aroma features with 30 neurons in the hidden layer).
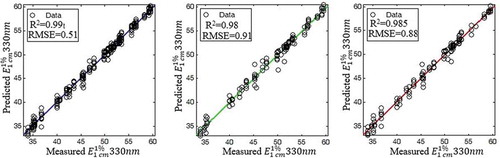
Figure 5. MLP model B-correlations between the predicted and actual values, from left to right: training, validation, and test sets (all the aroma features excluding the less-effective ones and 30 neurons in the hidden layer).
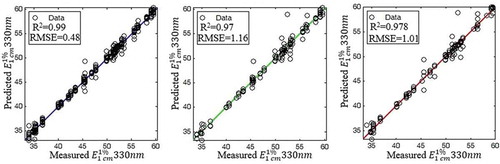
Figure 6. MLP model C-correlations between the predicted and actual values, from left to right: training, validation, and test sets (only the more effective aroma features with 30 neurons in the hidden layer).
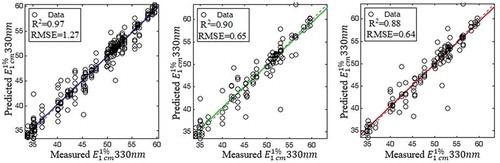
Figure 7. MLP model D- correlations between the predicted and actual values, from left to right: training, validation, and test sets (data from MOS sensors excluding the less-effective sensors and 50 neurons in the hidden layer).
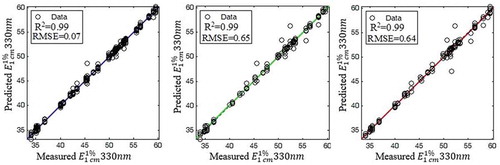
Figure 8. Training, validation, and test performance of the MLP model D.
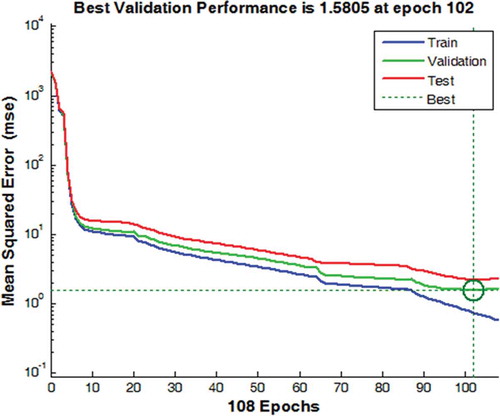
Figure 9. RBF model E, correlations between the predicted and actual (data of all the aroma features).
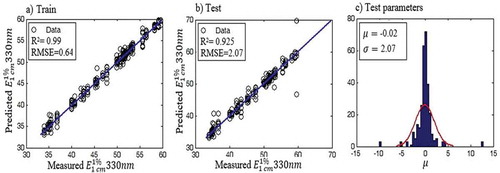
Figure 10. RBF model F, correlations between the predicted and actual (all aroma features excluding the less-effective ones).
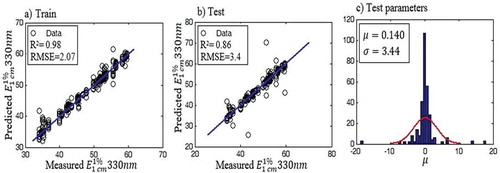
Figure 11. RBF model G, correlations between the predicted and actual (only the more-effective aroma features).