
Figures & data
Table 1. Experimental design for yogurt samples.
Table 2. Ketones and aldehydes in control (K) and purple basil flavoured (A, B, C, and D) yogurt samples (µg/kg yogurt).
Table 3. Esters in control (K) and purple basil flavoured (A, B, C, and D) yogurt samples (µg/kg yogurt).
Table 4. Acids in control (K) and purple basil flavoured (A, B, C, and D) yogurt samples (µg/kg yogurt).
Table 5. Alcohols in control (K) and purple basil flavoured (A, B, C, and D) yogurt samples (µg/kg yogurt).
Table 6. Terpenes in control (K) and purple basil flavoured (A, B, C, and D) yogurt samples (µg/kg yogurt).
Table 7. Miscellaneous compounds in control (K) and purple basil flavoured (A, B, C, and D) yogurt samples (µg/kg yogurt).
Figure 1. Bi-plots of principal components 1 and 2 showing the sample scores and variable loadings from principal component analysis of the volatile data for control (K) and purple basil flavoured (A, B, C, and D) yogurt samples after 1, 7, 14 and 21 days of storage.
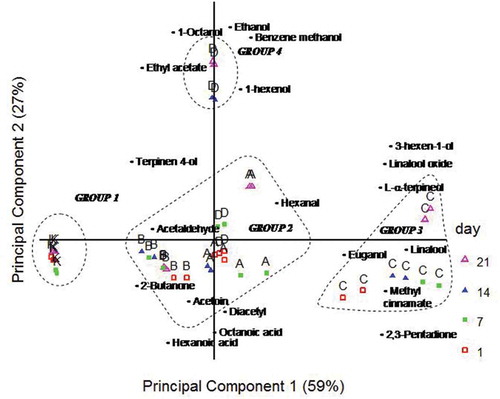
Table 8. Sensory scores obtained by sensory evaluation for control (K) and purple basil flavoured (A, B, C, and D) yogurt samples.