Figures & data
Figure 1. Solid fat content (g/100 g) of soft PMF, PMF0.5 with 0.5 g/100 g of PP, and PMF1.0 with 1 g/100g of PP, at various temperatures.
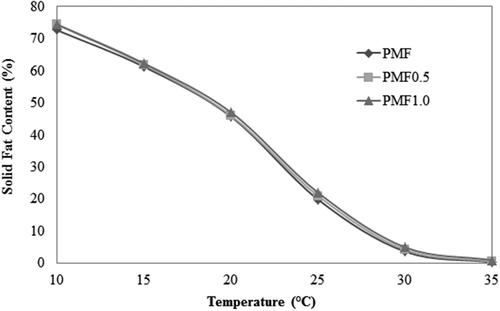
Table 1. The Avrami parameters of isothermal crystallization from soft palm mid-fraction (PMF) and their blends with dipalmitin (PP).
Figure 2. Isothermal crystallization at 17.5°C of pure soft PMF, PMF0.5 with 0.5 g/100 g of PP, and PMF1.0 with 1 g/100 g of PP.
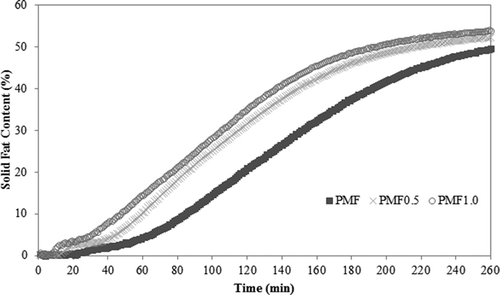
Table 2. Mean crystal diameter (Dm) and total crystallized area (CA) of soft palm mid-fraction (PMF) with dipalmitin (PP).
Figure 3. Polarized light micrograph of the crystal structure obtained under static isothermal crystallization at 17.5°C, for 3 h (PMF [A],PMF0.5[B], PMF1.0[C]), and at 25° C for 1 day (PMF [D], PMF0.5[F], PMF 1.0[H]) and 7 days (PMF [E], PMF0.5 [G], PMF1.0 [I]), magnification of 40x (scale bar = 50 μm).
![Figure 3. Polarized light micrograph of the crystal structure obtained under static isothermal crystallization at 17.5°C, for 3 h (PMF [A],PMF0.5[B], PMF1.0[C]), and at 25° C for 1 day (PMF [D], PMF0.5[F], PMF 1.0[H]) and 7 days (PMF [E], PMF0.5 [G], PMF1.0 [I]), magnification of 40x (scale bar = 50 μm).](/cms/asset/2202dc6a-f73a-4d9c-9adb-ba8e356c21a0/ljfp_a_1318290_f0003_b.gif)
Table 3. Consistency expressed as yield value (Pa), measured at 25°C, of blends of soft palm mid-fraction (PMF) and dipalmitin (PP).
Figure 4. Thermal behavior of the PMF samples, PMF, PMF0.5, and PMF1.0; (A) crystallization curves; (B) melting curves on zero time; (C) melting curves after 1 day; (D) melting curve of pure dipalmitin; (E) melting curves after 7 days; (F) melting curves after 14 days; (G) melting curves after 21 days. See for an explanation of abbreviations.
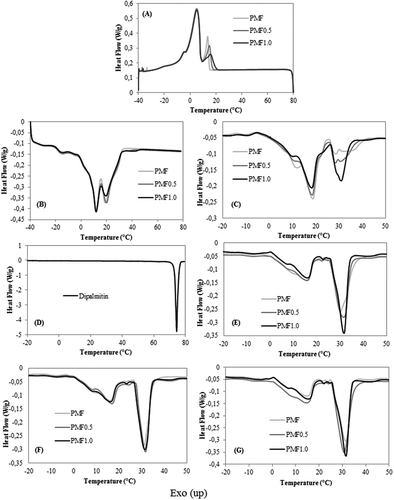
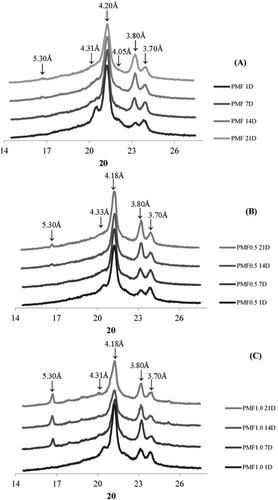
Figure 5. Diffractograms of pure soft PMF (A), PMF0.5 (B), and PMF1.0 (C) after 1, 7, 14, and 21 days at 25°C. See for an explanation of abbreviations.