Figures & data
Table 1. Physical characteristics and relaxation times of cakes containing different formulations.
Figure 1. Proton density weighted SE images of cakes with different formulations. (a) Cakes with different oil content. Top: High oil cake, middle: Low oil cake, bottom: Control cake. (b) Cakes with peanut/raisin. Top: Control cake, middle: Raisin cake, bottom: Peanut cake. *Cakes in the same row are replicates.
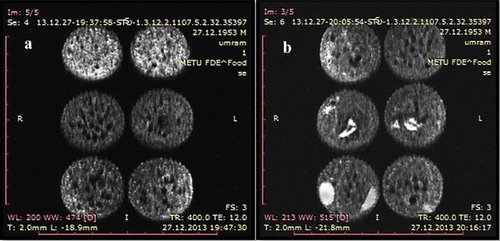
Figure 2. Sagittal MR images of cakes (TR = 1000, TE = 12 ms) showing slice positions of coronal images. Slice 1 to 5 descending from top to middle.
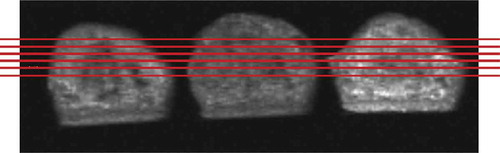
Figure 3. Fat suppression SE images of cakes with different formulations. (a) Cakes with different oil content. Top: High oil cake, middle: Low oil cake, bottom: Control cake. (b) Cakes with peanut/raisin. Top: Control cake, middle: Raisin cake, bottom: Peanut cake. *Cakes in the same row are replicates.
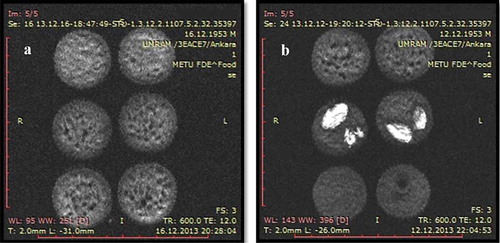
Figure 4. Water suppression SE images of cakes with different formulations. (a) Cakes with different oil content. Top: High oil cake, middle: Low oil cake, bottom: Control cake. (b) Cakes with peanut/raisin. Top: Control cake, middle: Raisin cake, bottom: Peanut cake. *Cakes in the same row are replicates.
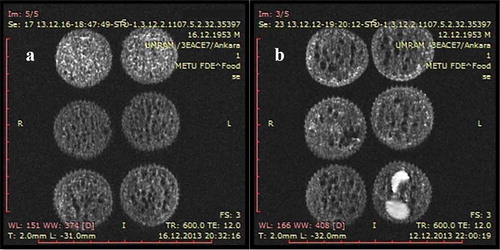
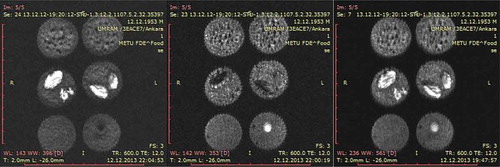
Figure 5. SE images of cakes with peanut/raisin. Top: Control cake, middle: Raisin cake, bottom: Peanut cake. Fat suppression SE images (left), water suppression SE images (middle), proton density weighted SE images (right). *Cakes in the same row are replicates.