
Figures & data
Table 1. Starch content of rice samples in different cycles.
Figure 1. Hyperspectral imaging system.
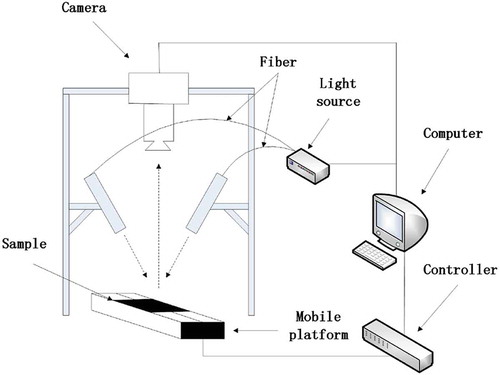
Figure 2. Full procedure for selecting regions of interest.
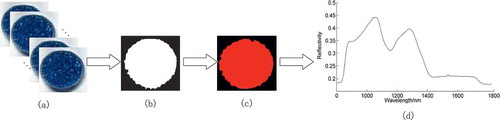
Figure 3. Raw spectra of rice samples.
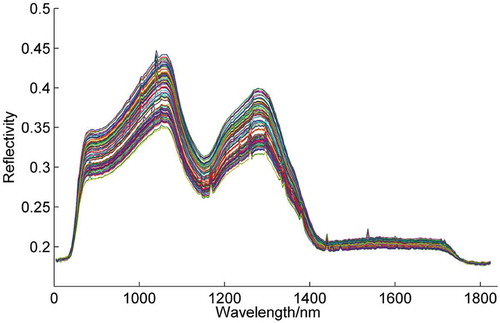
Table 2. Results of starch content prediction of rice using the full spectral range.
Table 3. Results of starch content prediction of rice using the optimal wavelengths.