
Figures & data
Table 1. Fatty acid composition of extra virgin olive oil (EVOO), grape seed oil (GSO), soybean oil (SO), and walnut oil (WO) using gas chromatography-flame ionization detector.
Figure 1. FTIR spectra of extra virgin olive oil (EVOO), grape seed oil (GSO), soybean oil (SO), and walnut oil (WO) scanned at the mid-infrared region (4000–650 cm−1).
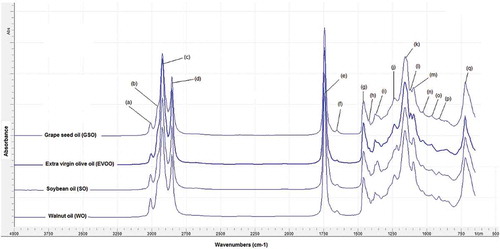
Figure 2. The Cooman plot for the classification of extra virgin olive oil (EVOO) and adulterated EVOO with other vegetable oils. (□) EVOO; (Δ) EVOO containing adulterants of grape seed oil (A); soybean oil (B); and walnut oil (C).
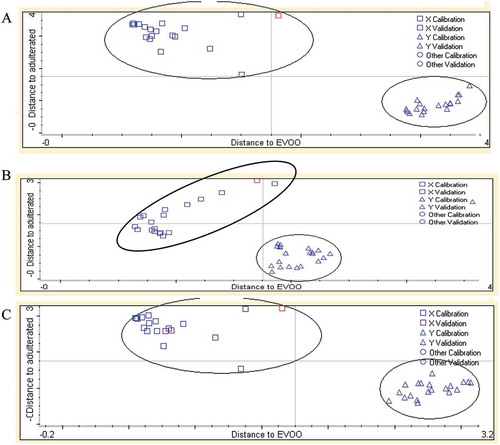
Table 2. Functional groups and vibration modes of peaks and shoulders of the FTIR spectra of extra virgin olive oil (EVOO) and other vegetable oils [Citation13].
Table 3. Multivariate calibration of partial least square (PLS) and principle component regression (PCR) for quantitative analysis of grape seed oil, soybean oil, and walnut oil as adulterants in extra virgin olive oil (EVOO)*.