Figures & data
Table 1. Proximate analysis of SBM and SPI (wet basis).
Figure 1. Soybean var. Grobogan: (a) the beans, (b) soybean meal, and (c) soy protein powder.
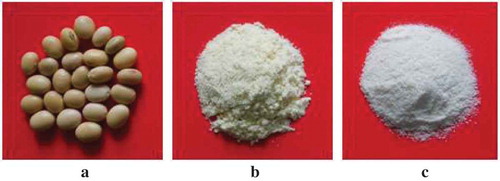
Figure 2. Proximate compositions (dry basis) of the soybean var. Grobogan, the SBM, the defatted SBM, and the isolated protein. (![]()
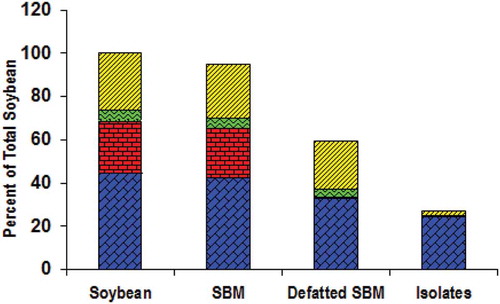
Figure 3. Solutions containing nanofibrils made of SPI from soybean var. Grobogan (a and c) and WPI (b and d). The pictures of c and d were taken by placing the solutions in between a cross-polariser.
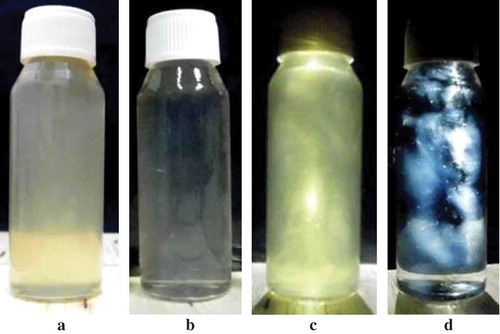
Figure 4. TEM pictures of protein nanofibrils prepared from (a) SPI of soybean var. Grobogan and (b) WPI.
Figure 5. Viscosity profiles of unheated protein suspension/solution (pH 2.0) and fibril solutions of (a) SPI of soybean var. Grobogan and (b) WPI, measured at 30°C. (![]()
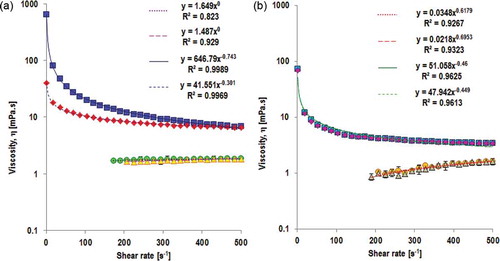
Figure 6. SEM images of microcapsules made of SPI nanofibrils (a) and WPI nanofibrils (b).