Figures & data
Table 1. List of citrus fruits studied in this work and abbreviations used in text.
Table 2. Physicochemical characterization of the citrus fruit juices.1
Figure 1. Electrical conductivity of citrus juices as a function of temperature including linear regressions from Eq. (11) and .
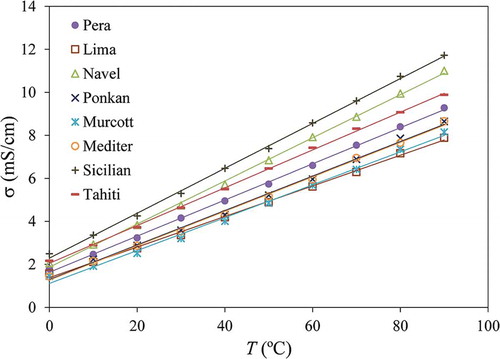
Table 3. Linear regression parameters determined for the temperature dependence on the electrical conductivity of the citrus fruit juices (between 0 and 90°C), along with standard errors of estimate and coefficients of determination.
Table 4. Polynomial regression parameters determined for the temperature dependence on the relative electric permittivity (ε’) of the citrus fruit juices (between 0 and 90°C) for the frequencies of 915 and 2450 MHz, along with standard errors of estimate and coefficients of determination.
Figure 2. Dielectric properties of Pera orange juice (average of triplicate) for temperatures between 0°C and 90°C and in the frequency range of 500–3000 MHz. Top: relative electrical permittivity (). Middle: dielectric loss factor (
). Bottom: Cole–Cole plot of the complex permittivity (
).
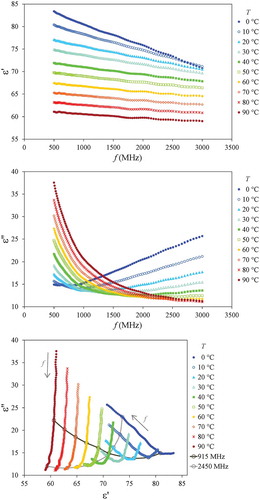
Figure 3. Relative electrical permittivity (), dielectric loss factor (
), and microwave penetration depth (
, mm) of the citrus fruit juices for temperatures between 0°C and 90°C and at frequencies of 915 MHz and 2450 MHz including the polynomial regressions from Eqs. (12), (13), and (14) and , , and .
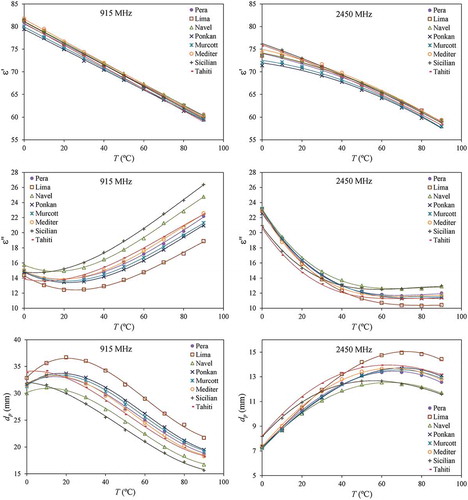
Table 5. Polynomial regression parameters determined for the temperature dependence on the dielectric loss factor (ε”) of the citrus fruit juices (between 0 and 90°C) for the frequencies of 915 and 2450 MHz, along with standard errors of estimate and coefficients of determination.
Figure 4. Contribution of ionic conduction to the loss factor () of the citrus fruit juices at frequencies of 915 MHz and 2450 MHz as calculated from Eqs. (2) and (6a) using the correlations in Eq. (11) and for electrical conductivity and Eq. (13) and for loss factor. Dotted lines indicate the region of contribution between 45% and 55%.
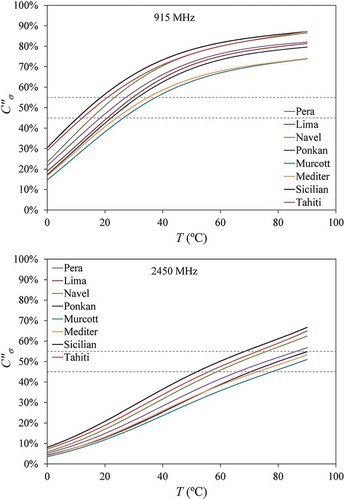
Table 6. Absolute errors for the prediction of dielectric properties (,
) and electrical conductivity (
) of orange juice blends made with Pera and Lima fruits (means and standard deviation for temperatures between 0 and 90°C)
Figure 5. Correction factors for the relative electrical permittivity of water () and for the dipolar loss factor of water (
) calculated for the citrus fruit juices at frequencies of 915 MHz and 2450 MHz using Eqs. (7)–(10b) and the correlations in Eqs. (12) and (13) , , and .
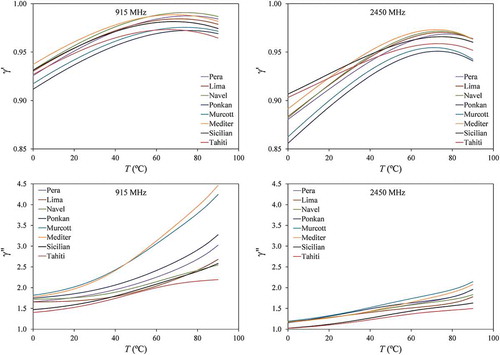
Table 7. Multiple regression parameters determined for the correlation of the corrections factors ( and
at 915 and 2450 MHz) of the citrus fruit juices with temperature and physicochemical parameters, along with standard errors of estimate and adjusted coefficients of determination
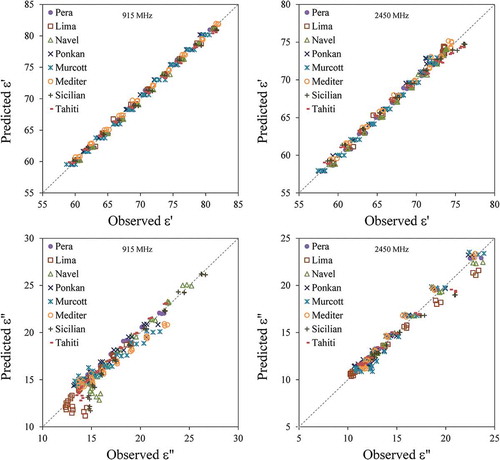
Figure 6. Parity charts for predicting the relative electrical permittivity () and the dielectric loss factor (
) of the citrus fruit juices using the proposed semiempirical model and the correlation in Eq. (15) and .