Figures & data
Table 1. Effect of phase composition in PEG1000-salt ATPS on partitioning of liver proteinase from albacore tuna.
Table 2. Effect of PEG molecular mass and concentration in a PEG-NaH2PO4 ATPS on partitioning of liver proteinase from albacore tuna.
Figure 1. Effect of system pH on the purification factor (a) and proteinase recovery (b) of liver proteinase partitioning in 25% PEG1000-20% NaH2PO4 ATPS. Bars represented the standard deviation from triplicate determinations. Different letters within the same parameter indicate the significant differences (P<0.05).
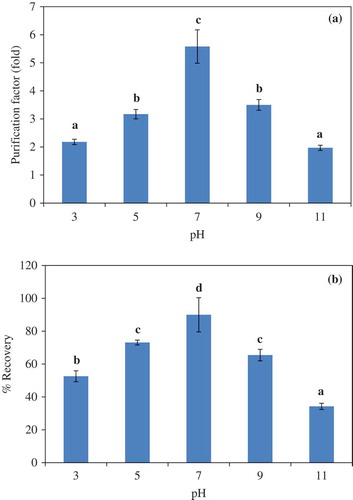
Figure 2. Effect of NaCl concentration on the purification factor (a) and proteinase recovery (b) of liver proteinase partitioning in 25% PEG1000-20% NaH2PO4 ATPS at pH 7.0. Bars represented the standard deviation from triplicate determinations. Different letters within the same parameter indicate the significant differences (P<0.05).
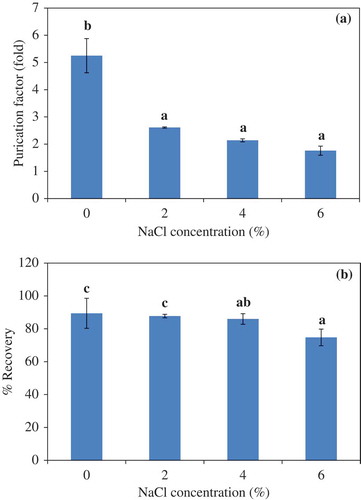
Figure 3. SDS-PAGE of liver extract and ATPS fraction from albacore tuna. M, molecular weight standard; lane 1, liver extract; lane 2, 20% PEG1000-20% NaH2PO4 ATPS fraction; lane 3, 25% PEG1000-20% NaH2PO4 ATPS fraction; lane 4, 25% PEG1000-20% NaH2PO4, pH 7.0 ATPS fraction.
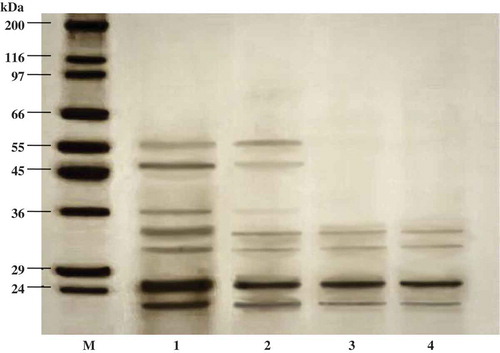
Figure 4. Activity staining of liver extract and ATPS fraction from albacore tuna. M, molecular weight standard; lane 1, liver extract; lane 2, 20% PEG1000-20% NaH2PO4 ATPS fraction; lane 3, 25% PEG1000-20% NaH2PO4 ATPS fraction; lane 4, 25% PEG1000-20% NaH2PO4, pH 7.0 ATPS fraction.
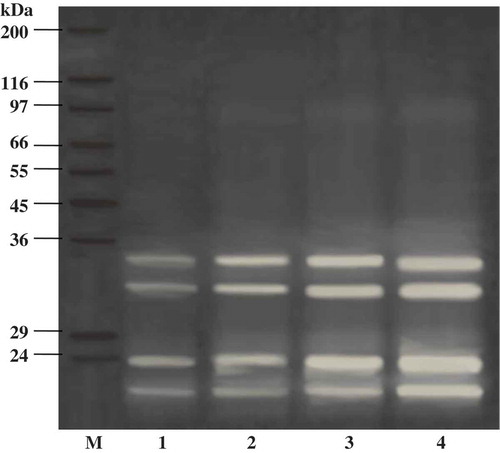
Figure 5. Degree of hydrolysis (DH) of starry triggerfish muscle during hydrolysis with liver enzyme from ATPS fraction (top phase of system 25% PEG1000-20% NaH2PO4, pH 7.0). The hydrolytic reaction was performed at pH 8.5, 55°C. Bars represented the standard deviation from triplicate determinations.
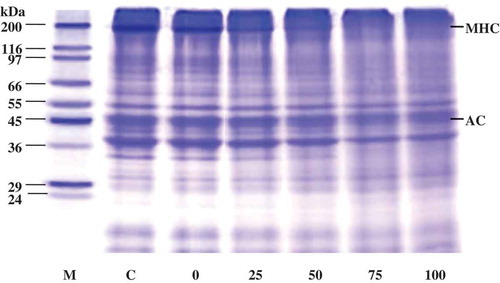
Figure 6. SDS-PAGE patterns of starry triggerfish muscle with liver enzyme from ATPS fraction (top phase of system 25% PEG1000-20% NaH2PO4, pH 7.0). The hydrolytic reaction was performed at pH 8.5, 55°C. Numbers designate the enzyme level (unit). M: molecular weight standard; C: control MHC: myosin heavy chain; AC: actin.