Figures & data
Table 1. Protein carbonyl, free sulfhydryl, total sulfhydryl, disulfide bond, and surface hydrophobicity of RBP incubated with increasing concentrations of AAPH.
Figure 1. Intrinsic fluorescence of native and modified RBP.
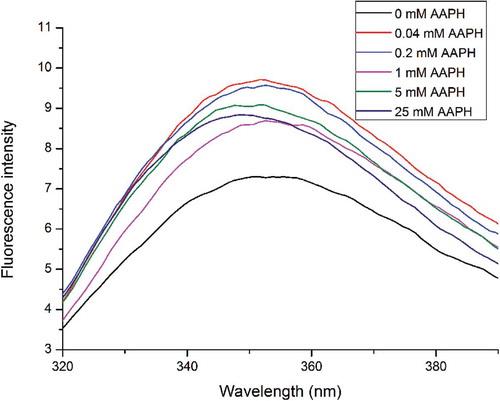
Figure 2. Effect of oxidization on the FT-IR spectra of RBP (a) and deconvolution of the amide I spectra (continuous curve), the GCF bands thereof (point line), and the second-derivative spectra of RBP (b).
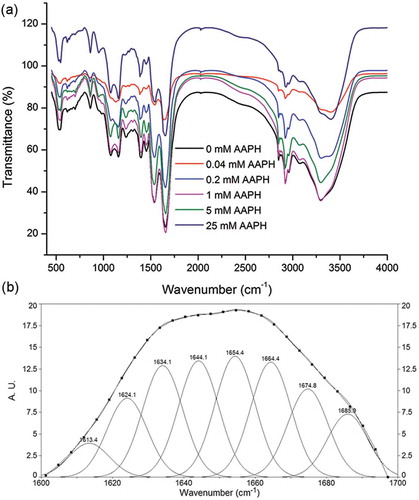
Table 2. Effects of the oxidization treatment on the secondary structures of RBP.
Figure 3. SDS-PAGE profiles of native and oxidized RBP.
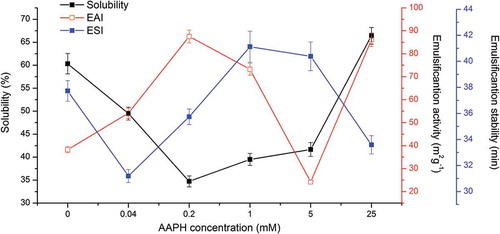
Figure 4. Solubility, EAI, and ESI of native and oxidized RBP.