Figures & data
Figure 1. Total phenolic content (TPC) in four Tunisian barley varieties. Means (expressed as mg GAE⋅g−1 DW) of three replicates followed by at least one same letter are not significantly different at p < 0.05.
Table 1. Antioxidant activities of seed extracts of Tunisian barley varieties.
Figure 2. Antimicrobial properties of barley seed extracts. In vitro evaluation of the antibacterial activity of various barley extracts against five pathogenic microorganisms expressed as percentage of growth inhibition. Means of three replicates followed by at least one same letter are not significantly different at p < 0.05.
Table 2. LC-DAD-ESI-MS determination of phenolic compounds in four Tunisian barley varieties.
Table 3. Pearson’s correlation test between TPC and various antioxidant assays evaluation indices and among the different methods used to evaluate antioxidant activity.
Figure 3. HPLC-DAD-ESI-MS chromatograms of phenolic compounds in four Tunisian barley varieties. The chromatogram was obtained for the maximum wavelength at each time point. 1: GC-GC-C; 2: catechin-3-glucose; 3: procyanidin B3; 4: catechin; 5: vanillic acid; 6: hydroferuloyl glucose; 7: synapoyl hexose.
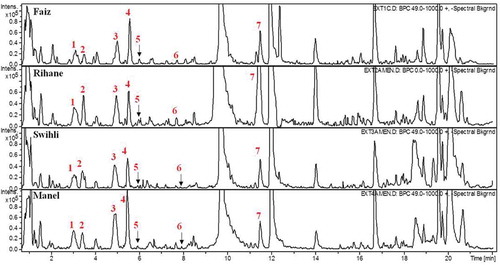
Figure 4. Contents in flavanols (a) and phenolic acids (b) as a function of barley variety.
Figure 5. Proportion (%) of procyanidin B3 compared to the rest of flavanols and phenolic acid family in Tunisian barley varieties.
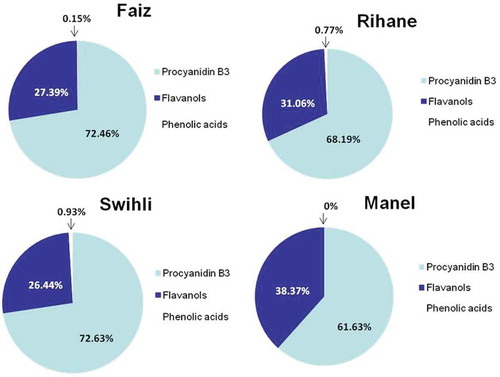
Table 4. Pearson’s correlation test between the antioxidant activity (DPPH assay) and the individual phenolic compounds.
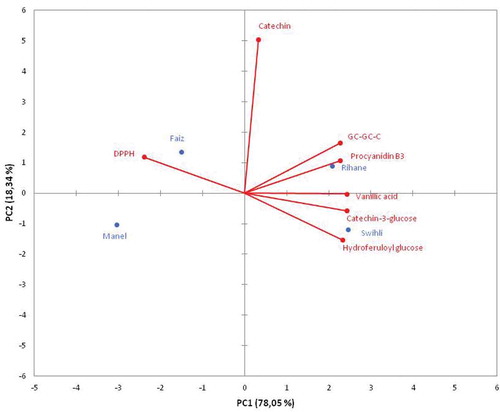
Figure 6. Scores plot obtained by principal component analysis of different barley varieties based on their antioxidant activity and individual phenolic compounds contents.