Figures & data
Figure 1. Image of the various stages in the two samples test environment (a. Water curing and b. Brine curing).
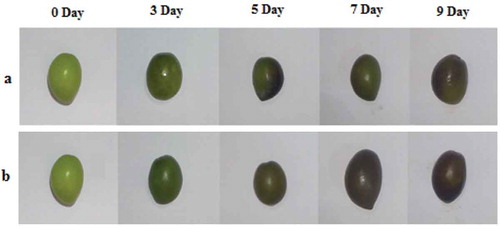
Figure 2. Schematic diagram of computer vision system for colour extraction and classification.
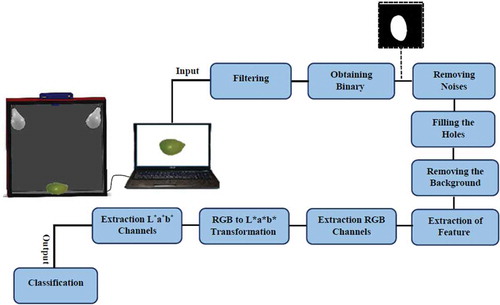
Figure 3. Changes in L*a*b* values using image analysis of olive during storage for nine day (a: L* Intensity, b: A* Intensity, c: b* Intensity).
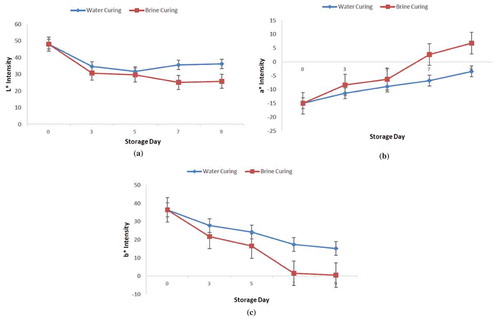
Table 1. Mean comparison of storage day and colour spaces RGB and L*a*b* (brine curing).
Table 2. Mean comparison of storage day and colour spaces RGB and L*a*b*(water curing).
Figure 4. Changes in RGB values using image analysis of olive during storage for nine day (a: Red Intensity, b: Green Intensity, c: Blue Intensity).
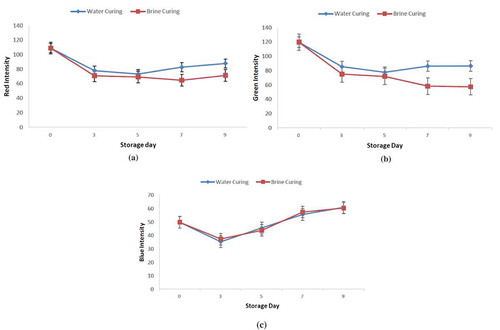
Table 3. Mean comparison of storage day and sensory parameters (Water and brine curing).
Table 4. Correlation between colour parameters and sensory test in water curing environment.
Table 5. Correlation between colour parameters and sensory test in brine curing environment.
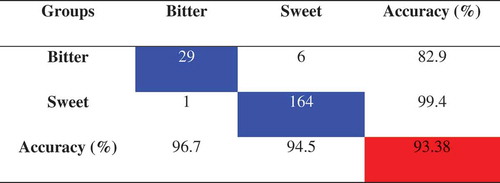
Figure 5. Classification results from the artificial neural network analysis of bitter and sweet olive groups.