Figures & data
Table 1. Formula of the beef–rat meat sausage.
Figure 1. FTIR spectra of the lipid extracted from beef–rat meat sausage at concentration 0% (beef lipid) and 100% (rat lipid) using Bligh and Dyer method (a), Folch method (b), and Soxhlet method (c). Rat lipid (green), beef lipid (red).
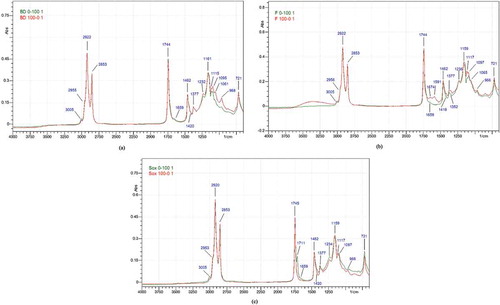
Figure 2. The overlay of FTIR spectra of the lipid extracted from beef–rat meat sausage at concentration 100% (rat lipid) using Bligh and Dyer (blue), Folch (red), and Soxhlet (green) method, (a) 1745 cm−1 (b) 1711 cm−1 (c) 1232 cm−1 (d) 1161 cm−1 (e) 1095 cm−1.
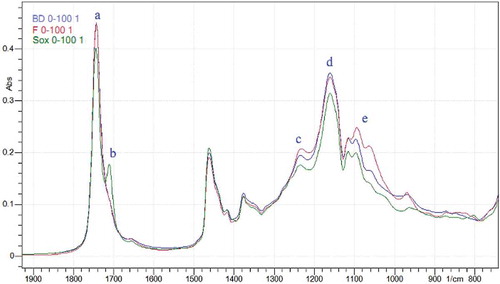
Figure 3. Score plot of PCA of the spectrum of the lipid extracted from beef–rat meat sausage (rat lipid 100% and beef lipid 100%) with Bligh and Dyer (a), Folch (b), and Soxhlet (c) using PC1 vs PC2. Rat lipid group (A), beef lipid group (B).
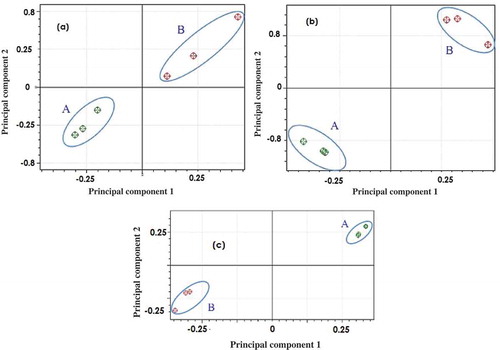
Figure 4. Score plot of PCA of lipid extracted from beef–rat meat sausage (rat lipid 100% and beef lipid 100%) and the market samples with Soxhlet method using PC1 vs PC2 (a), PC2 vs PC3 (b), and PC3 vs PC4 (c). Rat lipid group (A), beef lipid group (B), and market sample group (S).
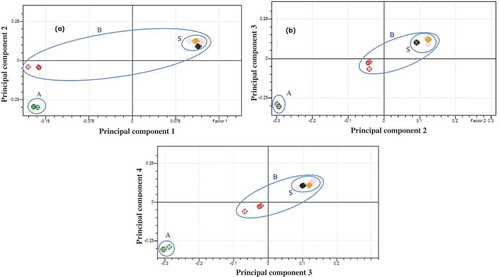
Table 2. PLS regression analysis result of the spectra of rat lipid and beef lipid extracted using three different lipid extraction methods.
Table 3. Relative percentage of fatty acid compositions of rat lipid and beef lipid extracted using three different extraction methods.
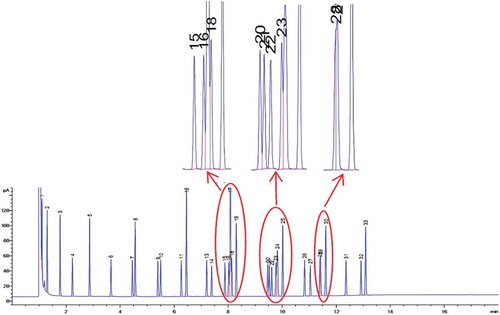
Figure 5. Chromatogram of 37 Component FAME Mix mixture standard. Peak elution order: 1.C6:0, 2.C8:0, 3.C10:0, 4.C11:0, 5.C12:0, 6.C13:0, 7.C14:1 cis 9, 8.C14:0, 9.C15:1 cis 9, 10.C15:0, 11.C16:1 cis 9, 12.C16:0, 13.C17:1 cis 10, 14.C17:0, 15–18.Unsaturated C18, 19.C18:0, 20–24.Unsaturated C20, 25.C20:0, 26.C21:0, 27–29.Unsaturated C22, 30.C22:0, 31.C23:0, 32.C24:1 cis 15, 33.C24:0.