Figures & data
Figure 1. FT-IR spectra of native glucomannan (lot A) (A) and weakly deacetylated (lot L) (B) glucomannan gels at 5g/100 mL of concentration at different high hydrostatic pressures 0MPa (A0 and L0); 100 MPa (A100 and L100); 200 MPa (A200 and L200); 400 MPa (A400 and L400), and 600 MPa (A600 and L600).
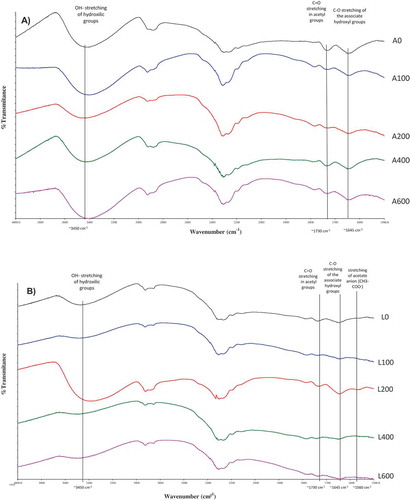
Table 1. Effect of high pressure on the linear viscoelastic (LVE) parameters for native (A0–A600), and slightly deacetylated (L0–L600) glucomannan (GM) gels, at 5 g/100 mL concentration, frequency: 1 Hz T = 25°C.
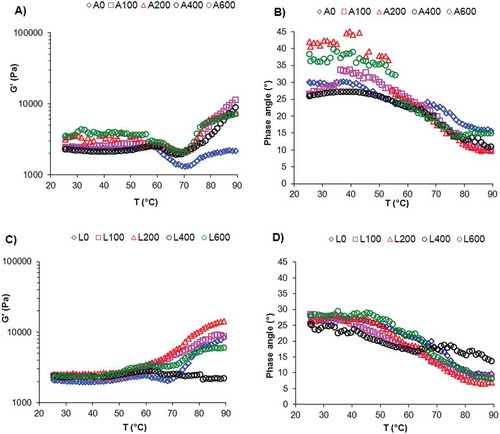
Figure 2. Thermal profiles of native (A, B) and weakly deacetylated (C, D) glucomannan gels at 5 g/100 mL at several high hydrostatic pressures: 0M Pa (A0 and L0), 100 MPa (A100 and L100), 200 MPa (A200 and L200), 400 MPa (A400 and L400), and 600 MPa (A600 and L600). Changes in storage modulus (G?) (A, C) and phase angle (?) (B, D).