
Figures & data
Figure 1. Effect of MP-HPH on the particle size distribution (PSD) of FCOJ.
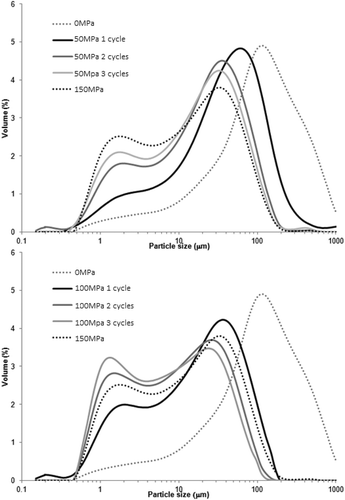
Figure 2. Effect of MP-HPH on the mean particle diameters (D[4,3] and D[3,2]) for FCOJ (Vertical lines are standard deviation; different letters represent significantly different values (p < 0.05).).
![Figure 2. Effect of MP-HPH on the mean particle diameters (D[4,3] and D[3,2]) for FCOJ (Vertical lines are standard deviation; different letters represent significantly different values (p < 0.05).).](/cms/asset/cb9b4790-651b-4c66-a7b4-37f153487f93/ljfp_a_1362653_f0002_b.gif)
Figure 3. FCOJ primary parameters of instrumental colour (CieLAB system) as a function of the MP-HPH process (vertical lines are the standard deviation, the values for each parameter show no statistical difference in relation to the homogenization pressure (p < 0.05)).
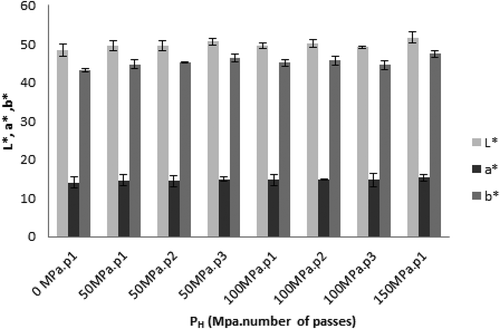
Table 1. Effect of single and multiple HPH processing on flow properties of FCOJ: Ostwald–de-Waele model (Eq. (4)) at −10°C.
Figure 4. Flow behaviour of FCOJ at −10°C: Effect of MP-HPH.
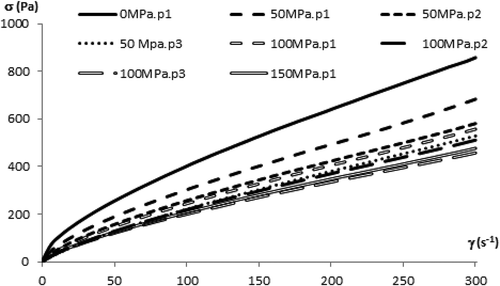
Figure 5. Shear stress against time (thixogram) for FCOJ during shearing at 300 s-1 at −10°C: Effect of MP-HPH.
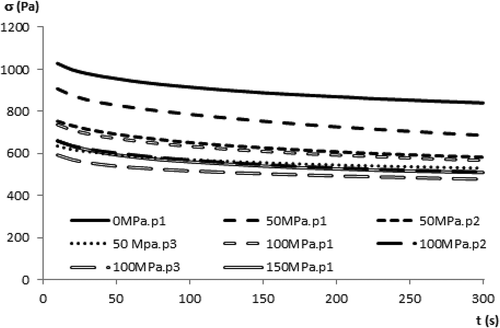
Table 2. Effect of single and multiple HPH processing on the thixotropic properties of FCOJ: Figoni–Shoemaker model (Eq. (3)) at −10°C.